29
/it/
it
AIzaSyAYiBZKx7MnpbEhh9jyipgxe19OcubqV5w
April 1, 2024
209065
New Zealand
NZL
true
2
1
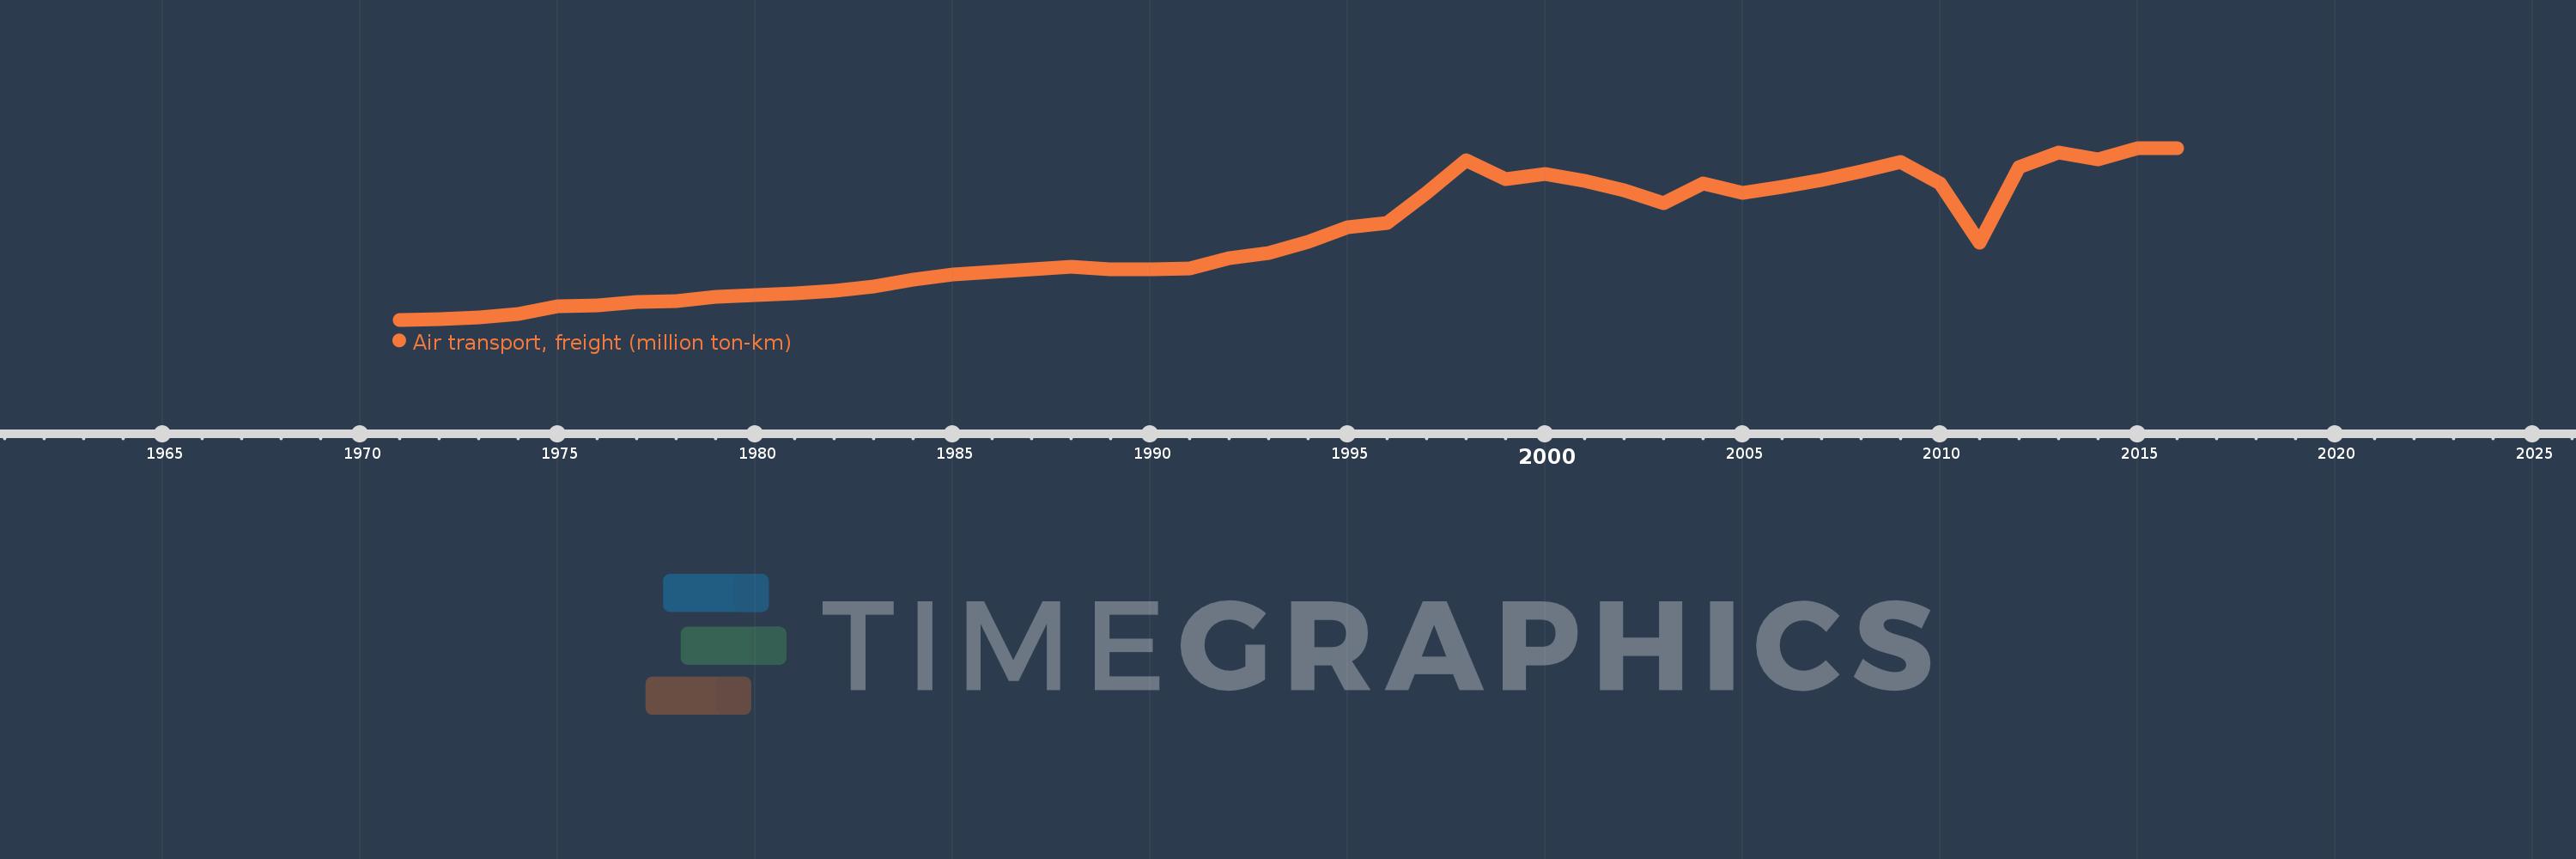
Air transport, freight (million ton-km)
2016,2015,2014,2013,2012,2011,2010,2009,2008,2007,2006,2005,2004,2003,2002,2001,2000,1999,1998,1997,1996,1995,1994,1993,1992,1991,1990,1989,1988,1987,1986,1985,1984,1983,1982,1981,1980,1979,1978,1977,1976,1975,1974,1973,1972,1971
Queste statistiche in altri paesi:
AfghanistanAlbaniaAlgeriaAmerican SamoaAngolaAntigua and BarbudaArab WorldArgentinaArmeniaAustraliaAustriaAzerbaijanBahamas, TheBahrainBangladeshBarbadosBelarusBelgiumBelizeBeninBhutanBoliviaBosnia and HerzegovinaBotswanaBrazilBrunei DarussalamBulgariaBurkina FasoBurundiCabo VerdeCambodiaCameroonCanadaCaribbean small statesCentral African RepublicCentral Europe and the BalticsChadChileChinaColombiaComorosCongo, Dem. Rep.Congo, Rep.Costa RicaCote d'IvoireCroatiaCubaCyprusCzech RepublicDenmarkDjiboutiDominican RepublicEarly-demographic dividendEast Asia & PacificEast Asia & Pacific (excluding high income)East Asia & Pacific (IDA & IBRD countries)EcuadorEgypt, Arab Rep.El SalvadorEquatorial GuineaEritreaEstoniaEthiopiaEuro areaEurope & Central AsiaEurope & Central Asia (excluding high income)Europe & Central Asia (IDA & IBRD countries)European UnionFijiFinlandFragile and conflict affected situationsFranceGabonGambia, TheGeorgiaGermanyGhanaGreeceGuamGuatemalaGuineaGuinea-BissauGuyanaHaitiHeavily indebted poor countries (HIPC)High incomeHondurasHong Kong SAR, ChinaHungaryIBRD onlyIcelandIDA & IBRD totalIDA blendIDA onlyIDA totalIndiaIndonesiaIran, Islamic Rep.IraqIrelandIsraelItalyJamaicaJapanJordanKazakhstanKenyaKiribatiKorea, Dem. People’s Rep.Korea, Rep.KuwaitKyrgyz RepublicLao PDRLate-demographic dividendLatin America & Caribbean Latin America & Caribbean (excluding high income)Latin America & the Caribbean (IDA & IBRD countries)LatviaLeast developed countries: UN classificationLebanonLesothoLiberiaLibyaLithuaniaLow & middle incomeLow incomeLower middle incomeLuxembourgMacao SAR, ChinaMacedonia, FYRMadagascarMalawiMalaysiaMaldivesMaliMaltaMarshall IslandsMauritaniaMauritiusMexicoMiddle East & North AfricaMiddle East & North Africa (excluding high income)Middle East & North Africa (IDA & IBRD countries)Middle incomeMoldovaMonacoMongoliaMontenegroMoroccoMozambiqueMyanmarNamibiaNauruNepalNetherlandsNew ZealandNicaraguaNigerNigeriaNorth AmericaNorwayOECD membersOmanOther small statesPacific island small statesPakistanPanamaPapua New GuineaParaguayPeruPhilippinesPolandPortugalPost-demographic dividendPre-demographic dividendQatarRomaniaRussian FederationRwandaSamoaSao Tome and PrincipeSaudi ArabiaSenegalSerbiaSeychellesSierra LeoneSingaporeSlovak RepublicSloveniaSmall statesSolomon IslandsSomaliaSouth AfricaSouth AsiaSouth Asia (IDA & IBRD)SpainSri LankaSub-Saharan Africa Sub-Saharan Africa (excluding high income)Sub-Saharan Africa (IDA & IBRD countries)SudanSurinameSwazilandSwedenSwitzerlandSyrian Arab RepublicTajikistanTanzaniaThailandTogoTongaTrinidad and TobagoTunisiaTurkeyTurkmenistanUgandaUkraineUnited Arab EmiratesUnited KingdomUnited StatesUpper middle incomeUruguayUzbekistanVanuatuVenezuela, RBVietnamWorldYemen, Rep.ZambiaZimbabwe Linea del tempo:
Questa scala temporale mostra un grafico dal 1971 anno al 2016 anno. New Zealand. I dati fino ad 1970 anno non disponibili. Il numero di osservazioni attuali secondo i date: 46.
La fonte (nome):
Indicatori dello sviluppo mondiale
La fonte (organizzazione):
International Civil Aviation Organization, Civil Aviation Statistics of the World and ICAO staff estimates.
Categorie:
Infrastructure
sono stati aggiornati
23 apr 2017 anni
Indicatori delle variazioni dei valori per anni
Minima:
35.8
1 gen 1971 anni
Massimo:
999.385
1 gen 2016 anni
Alla data di osservazione
Valore
Variazione assoluta
La variazione rispetto al valore precedente
1 gen 1971 anni
35.8
+35.8
0.0%
1 gen 1972 anni
41.5
+5.7
15.92%
1 gen 1973 anni
48.7
+7.2
17.35%
1 gen 1974 anni
68.6
+19.9
40.86%
1 gen 1975 anni
110.3
+41.7
60.79%
1 gen 1976 anni
114.5
+4.2
3.81%
1 gen 1977 anni
136.7
+22.2
19.39%
1 gen 1978 anni
140.7
+4.0
2.93%
1 gen 1979 anni
164.0
+23.3
16.56%
1 gen 1980 anni
176.3
+12.3
7.5%
1 gen 1981 anni
185.9
+9.6
5.45%
1 gen 1982 anni
199.6
+13.7
7.37%
1 gen 1983 anni
221.4
+21.8
10.92%
1 gen 1984 anni
262.9
+41.5
18.74%
1 gen 1985 anni
288.4
+25.5
9.7%
1 gen 1986 anni
305.4
+17.0
5.89%
1 gen 1987 anni
318.6
+13.2
4.32%
1 gen 1988 anni
335.4
+16.8
5.27%
1 gen 1989 anni
320.3
-15.1
-4.5%
1 gen 1990 anni
317.4
-2.9
-0.91%
1 gen 1991 anni
325.1
+7.7
2.43%
1 gen 1992 anni
379.9
+54.8
16.86%
1 gen 1993 anni
409.9
+30.0
7.9%
1 gen 1994 anni
473.0
+63.1
15.39%
1 gen 1995 anni
555.6
+82.6
17.46%
1 gen 1996 anni
580.3
+24.7
4.45%
1 gen 1997 anni
745.0
+164.7
28.38%
1 gen 1998 anni
928.4
+183.4
24.62%
1 gen 1999 anni
826.2
-102.2
-11.01%
1 gen 2000 anni
855.6
+29.4
3.56%
1 gen 2001 anni
817.137
-38.463
-4.5%
1 gen 2002 anni
762.982
-54.155
-6.63%
1 gen 2003 anni
687.521
-75.461
-9.89%
1 gen 2004 anni
800.524
+113.003
16.44%
1 gen 2005 anni
748.833
-51.691
-6.46%
1 gen 2006 anni
781.469
+32.636
4.36%
1 gen 2007 anni
819.0
+37.531
4.8%
1 gen 2008 anni
868.14
+49.14
6.0%
1 gen 2009 anni
920.847
+52.707
6.07%
1 gen 2010 anni
799.295
-121.552
-13.2%
1 gen 2011 anni
468.638
-330.657
-41.37%
1 gen 2012 anni
892.848
+424.21
90.52%
1 gen 2013 anni
975.021
+82.173
9.2%
1 gen 2014 anni
934.541
-40.48
-4.15%
1 gen 2015 anni
999.305
+64.764
6.93%
1 gen 2016 anni
999.385
+0.08
0.01%
Classificazione dei paesi secondo i statistiche attuali per anni


Commenti: