29
/it/
it
AIzaSyAYiBZKx7MnpbEhh9jyipgxe19OcubqV5w
April 1, 2024
214669
Norway
NOR
true
2
1
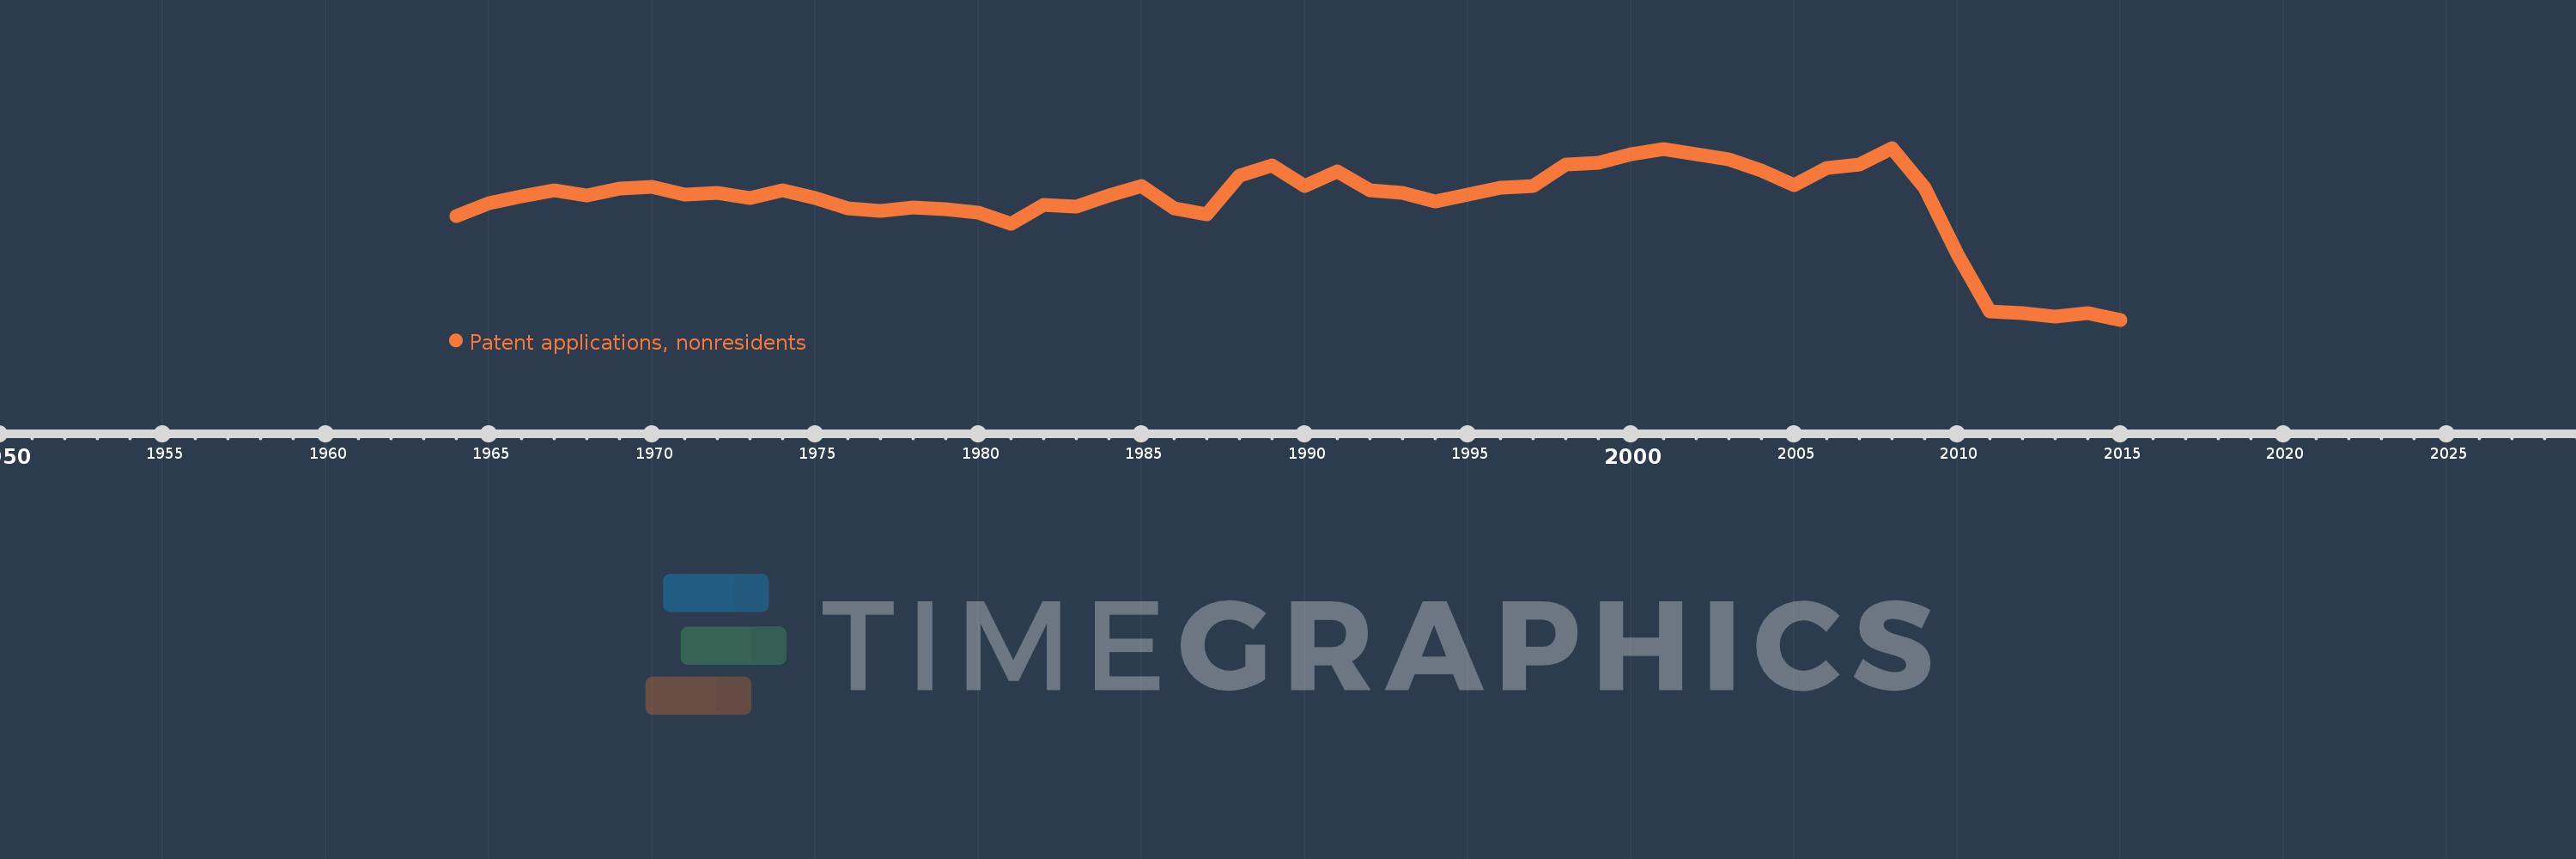
Patent applications, nonresidents
2015,2014,2013,2012,2011,2010,2009,2008,2007,2006,2005,2004,2003,2002,2001,2000,1999,1998,1997,1996,1995,1994,1993,1992,1991,1990,1989,1988,1987,1986,1985,1984,1983,1982,1981,1980,1979,1978,1977,1976,1975,1974,1973,1972,1971,1970,1969,1968,1967,1966,1965,1964
Queste statistiche in altri paesi:
AlbaniaAlgeriaAngolaAntigua and BarbudaArab WorldArgentinaArmeniaAustraliaAustriaAzerbaijanBahamas, TheBahrainBangladeshBarbadosBelarusBelgiumBelizeBhutanBoliviaBosnia and HerzegovinaBotswanaBrazilBrunei DarussalamBulgariaBurundiCambodiaCanadaCaribbean small statesCentral Europe and the BalticsChileChinaColombiaCongo, Dem. Rep.Congo, Rep.Costa RicaCote d'IvoireCroatiaCubaCyprusCzech RepublicDenmarkDjiboutiDominicaDominican RepublicEarly-demographic dividendEast Asia & PacificEast Asia & Pacific (excluding high income)East Asia & Pacific (IDA & IBRD countries)EcuadorEgypt, Arab Rep.El SalvadorEstoniaEthiopiaEuro areaEurope & Central AsiaEurope & Central Asia (excluding high income)Europe & Central Asia (IDA & IBRD countries)European UnionFijiFinlandFranceGambia, TheGeorgiaGermanyGhanaGreeceGrenadaGuatemalaGuyanaHaitiHigh incomeHondurasHong Kong SAR, ChinaHungaryIBRD onlyIcelandIDA & IBRD totalIDA blendIndiaIndonesiaIran, Islamic Rep.IraqIrelandIsraelItalyJamaicaJapanJordanKazakhstanKenyaKiribatiKorea, Dem. People’s Rep.Korea, Rep.KuwaitKyrgyz RepublicLao PDRLate-demographic dividendLatin America & Caribbean Latin America & Caribbean (excluding high income)Latin America & the Caribbean (IDA & IBRD countries)LatviaLebanonLesothoLiberiaLibyaLithuaniaLow & middle incomeLower middle incomeLuxembourgMacao SAR, ChinaMacedonia, FYRMadagascarMalawiMalaysiaMaliMaltaMauritiusMexicoMiddle East & North AfricaMiddle East & North Africa (excluding high income)Middle East & North Africa (IDA & IBRD countries)Middle incomeMoldovaMonacoMongoliaMontenegroMoroccoMozambiqueNamibiaNepalNetherlandsNew ZealandNicaraguaNigeriaNorth AmericaNorwayOECD membersPacific island small statesPakistanPanamaPapua New GuineaParaguayPeruPhilippinesPolandPortugalPost-demographic dividendQatarRomaniaRussian FederationRwandaSamoaSao Tome and PrincipeSaudi ArabiaSerbiaSeychellesSierra LeoneSingaporeSlovak RepublicSloveniaSolomon IslandsSomaliaSouth AfricaSouth AsiaSouth Asia (IDA & IBRD)SpainSri LankaSt. LuciaSt. Vincent and the GrenadinesSudanSwazilandSwedenSwitzerlandSyrian Arab RepublicTajikistanTanzaniaThailandTrinidad and TobagoTunisiaTurkeyTurkmenistanUgandaUkraineUnited Arab EmiratesUnited KingdomUnited StatesUpper middle incomeUruguayUzbekistanVenezuela, RBVietnamWorldYemen, Rep.ZambiaZimbabwe Linea del tempo:
Questa scala temporale mostra un grafico dal 1964 anno al 2015 anno. Norway. I dati fino ad 1963 anno non disponibili. Il numero di osservazioni attuali secondo i date: 52.
La fonte (nome):
Indicatori dello sviluppo mondiale
La fonte (organizzazione):
World Intellectual Property Organization (WIPO), WIPO Patent Report: Statistics on Worldwide Patent Activity. The International Bureau of WIPO assumes no responsibility with respect to the transformation of these data.
Categorie:
Science & Technology
sono stati aggiornati
23 apr 2017 anni
Indicatori delle variazioni dei valori per anni
Minima:
457.0
1 gen 2015 anni
Massimo:
5.431 Mille.
1 gen 2008 anni
Alla data di osservazione
Valore
Variazione assoluta
La variazione rispetto al valore precedente
1 gen 1964 anni
3.459 Mille.
+3.459 Mille.
0.0%
1 gen 1965 anni
3.841 Mille.
+382.0
11.04%
1 gen 1966 anni
4.029 Mille.
+188.0
4.89%
1 gen 1967 anni
4.209 Mille.
+180.0
4.47%
1 gen 1968 anni
4.048 Mille.
-161.0
-3.83%
1 gen 1969 anni
4.262 Mille.
+214.0
5.29%
1 gen 1970 anni
4.313 Mille.
+51.0
1.2%
1 gen 1971 anni
4.069 Mille.
-244.0
-5.66%
1 gen 1972 anni
4.131 Mille.
+62.0
1.52%
1 gen 1973 anni
3.99 Mille.
-141.0
-3.41%
1 gen 1974 anni
4.215 Mille.
+225.0
5.64%
1 gen 1975 anni
3.985 Mille.
-230.0
-5.46%
1 gen 1976 anni
3.679 Mille.
-306.0
-7.68%
1 gen 1977 anni
3.605 Mille.
-74.0
-2.01%
1 gen 1978 anni
3.71 Mille.
+105.0
2.91%
1 gen 1979 anni
3.665 Mille.
-45.0
-1.21%
1 gen 1980 anni
3.557 Mille.
-108.0
-2.95%
1 gen 1981 anni
3.247 Mille.
-310.0
-8.72%
1 gen 1982 anni
3.785 Mille.
+538.0
16.57%
1 gen 1983 anni
3.733 Mille.
-52.0
-1.37%
1 gen 1984 anni
4.068 Mille.
+335.0
8.97%
1 gen 1985 anni
4.332 Mille.
+264.0
6.49%
1 gen 1986 anni
3.694 Mille.
-638.0
-14.73%
1 gen 1987 anni
3.519 Mille.
-175.0
-4.74%
1 gen 1988 anni
4.616 Mille.
+1.097 Mille.
31.17%
1 gen 1989 anni
4.933 Mille.
+317.0
6.87%
1 gen 1990 anni
4.324 Mille.
-609.0
-12.35%
1 gen 1991 anni
4.745 Mille.
+421.0
9.74%
1 gen 1992 anni
4.213 Mille.
-532.0
-11.21%
1 gen 1993 anni
4.12 Mille.
-93.0
-2.21%
1 gen 1994 anni
3.886 Mille.
-234.0
-5.68%
1 gen 1995 anni
4.072 Mille.
+186.0
4.79%
1 gen 1996 anni
4.28 Mille.
+208.0
5.11%
1 gen 1997 anni
4.336 Mille.
+56.0
1.31%
1 gen 1998 anni
4.959 Mille.
+623.0
14.37%
1 gen 1999 anni
5.006 Mille.
+47.0
0.95%
1 gen 2000 anni
5.255 Mille.
+249.0
4.97%
1 gen 2001 anni
5.389 Mille.
+134.0
2.55%
1 gen 2002 anni
5.242 Mille.
-147.0
-2.73%
1 gen 2003 anni
5.109 Mille.
-133.0
-2.54%
1 gen 2004 anni
4.782 Mille.
-327.0
-6.4%
1 gen 2005 anni
4.348 Mille.
-434.0
-9.08%
1 gen 2006 anni
4.843 Mille.
+495.0
11.38%
1 gen 2007 anni
4.957 Mille.
+114.0
2.35%
1 gen 2008 anni
5.431 Mille.
+474.0
9.56%
1 gen 2009 anni
4.28 Mille.
-1.151 Mille.
-21.19%
1 gen 2010 anni
2.358 Mille.
-1.922 Mille.
-44.91%
1 gen 2011 anni
696.0
-1.662 Mille.
-70.48%
1 gen 2012 anni
654.0
-42.0
-6.03%
1 gen 2013 anni
555.0
-99.0
-15.14%
1 gen 2014 anni
648.0
+93.0
16.76%
1 gen 2015 anni
457.0
-191.0
-29.48%
Classificazione dei paesi secondo i statistiche attuali per anni


Commenti: