29
/it/
it
AIzaSyAYiBZKx7MnpbEhh9jyipgxe19OcubqV5w
April 1, 2024
157736
Iran, Islamic Rep.
IRN
true
2
1
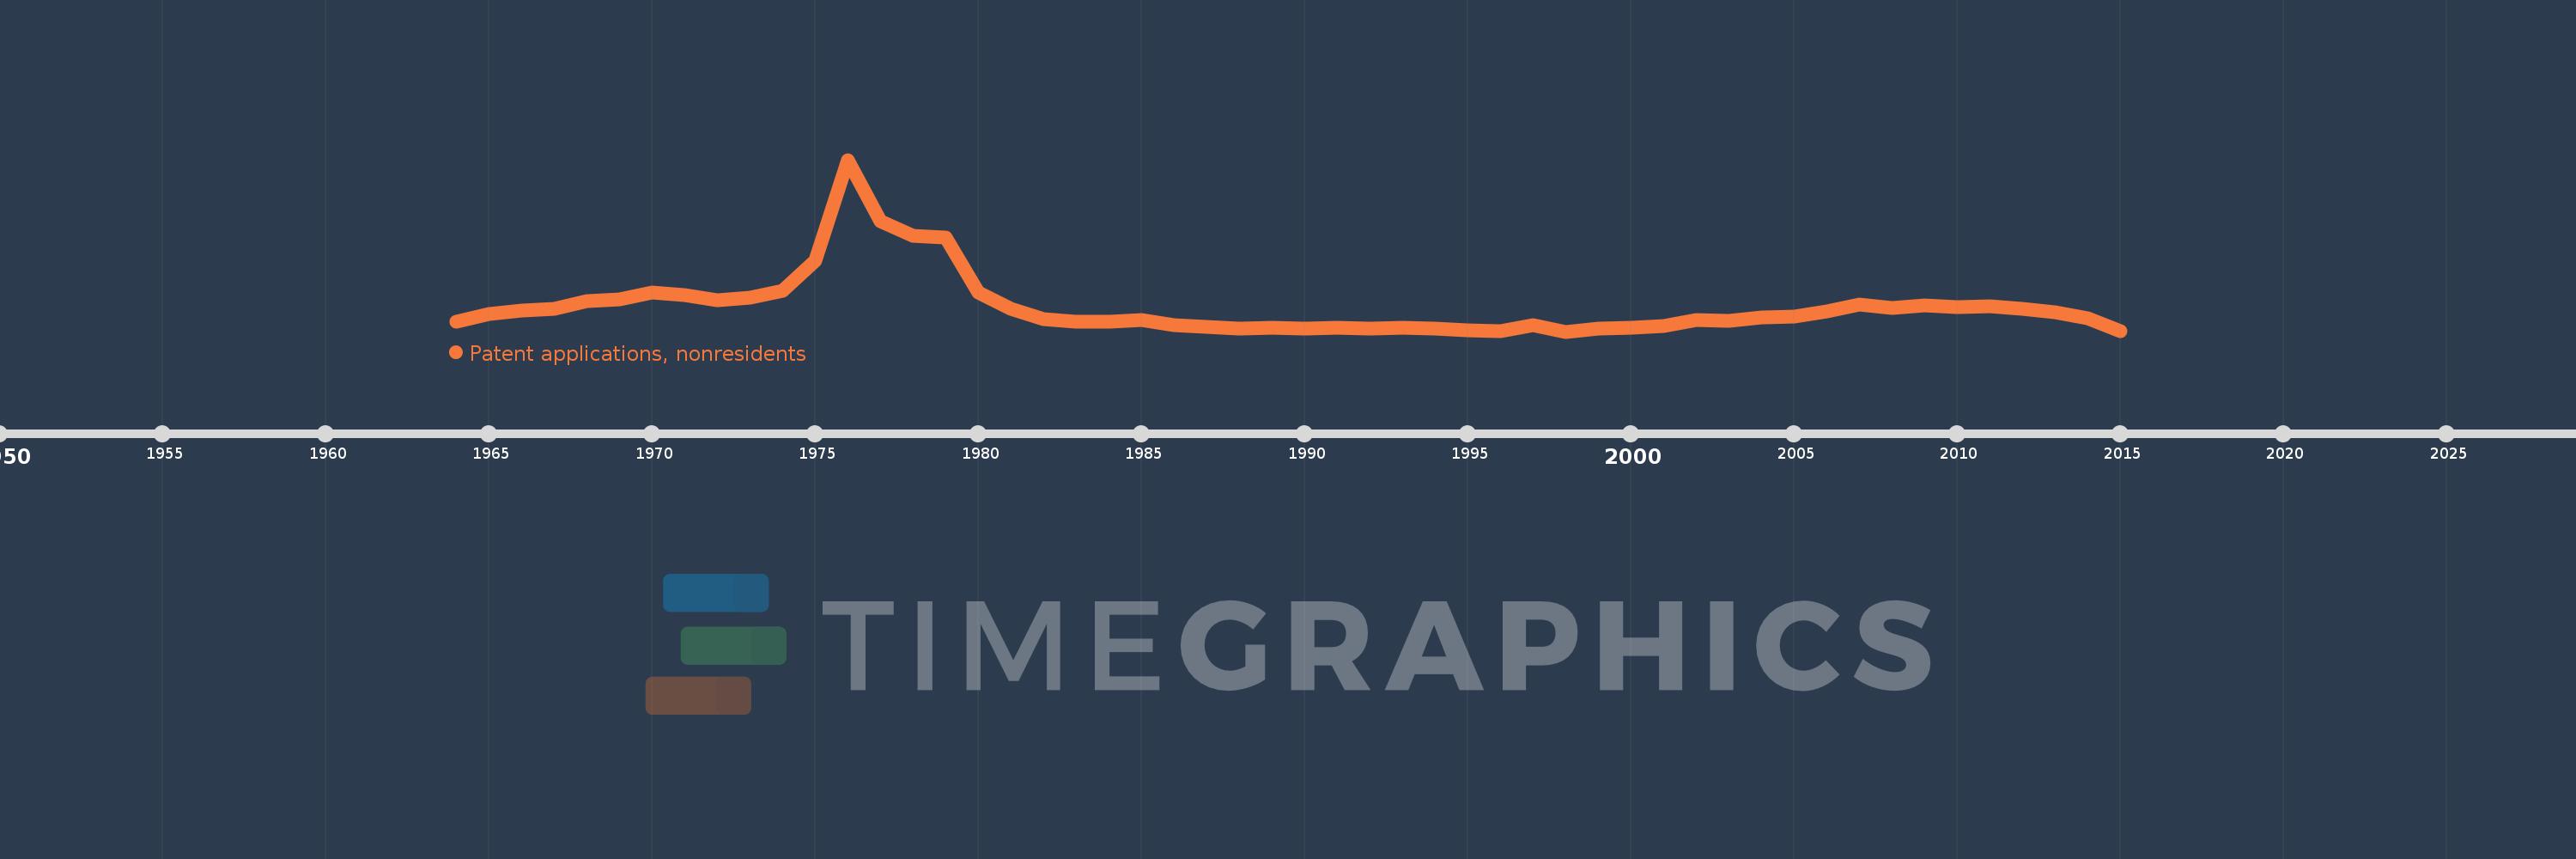
Patent applications, nonresidents
2015,2014,2013,2012,2011,2010,2009,2008,2007,2006,2005,2004,2003,2002,2001,2000,1999,1998,1997,1996,1995,1994,1993,1992,1991,1990,1989,1988,1986,1985,1984,1983,1982,1981,1980,1979,1978,1977,1976,1975,1974,1973,1972,1971,1970,1969,1968,1967,1966,1965,1964
Queste statistiche in altri paesi:
AlbaniaAlgeriaAngolaAntigua and BarbudaArab WorldArgentinaArmeniaAustraliaAustriaAzerbaijanBahamas, TheBahrainBangladeshBarbadosBelarusBelgiumBelizeBhutanBoliviaBosnia and HerzegovinaBotswanaBrazilBrunei DarussalamBulgariaBurundiCambodiaCanadaCaribbean small statesCentral Europe and the BalticsChileChinaColombiaCongo, Dem. Rep.Congo, Rep.Costa RicaCote d'IvoireCroatiaCubaCyprusCzech RepublicDenmarkDjiboutiDominicaDominican RepublicEarly-demographic dividendEast Asia & PacificEast Asia & Pacific (excluding high income)East Asia & Pacific (IDA & IBRD countries)EcuadorEgypt, Arab Rep.El SalvadorEstoniaEthiopiaEuro areaEurope & Central AsiaEurope & Central Asia (excluding high income)Europe & Central Asia (IDA & IBRD countries)European UnionFijiFinlandFranceGambia, TheGeorgiaGermanyGhanaGreeceGrenadaGuatemalaGuyanaHaitiHigh incomeHondurasHong Kong SAR, ChinaHungaryIBRD onlyIcelandIDA & IBRD totalIDA blendIndiaIndonesiaIran, Islamic Rep.IraqIrelandIsraelItalyJamaicaJapanJordanKazakhstanKenyaKiribatiKorea, Dem. People’s Rep.Korea, Rep.KuwaitKyrgyz RepublicLao PDRLate-demographic dividendLatin America & Caribbean Latin America & Caribbean (excluding high income)Latin America & the Caribbean (IDA & IBRD countries)LatviaLebanonLesothoLiberiaLibyaLithuaniaLow & middle incomeLower middle incomeLuxembourgMacao SAR, ChinaMacedonia, FYRMadagascarMalawiMalaysiaMaliMaltaMauritiusMexicoMiddle East & North AfricaMiddle East & North Africa (excluding high income)Middle East & North Africa (IDA & IBRD countries)Middle incomeMoldovaMonacoMongoliaMontenegroMoroccoMozambiqueNamibiaNepalNetherlandsNew ZealandNicaraguaNigeriaNorth AmericaNorwayOECD membersPacific island small statesPakistanPanamaPapua New GuineaParaguayPeruPhilippinesPolandPortugalPost-demographic dividendQatarRomaniaRussian FederationRwandaSamoaSao Tome and PrincipeSaudi ArabiaSerbiaSeychellesSierra LeoneSingaporeSlovak RepublicSloveniaSolomon IslandsSomaliaSouth AfricaSouth AsiaSouth Asia (IDA & IBRD)SpainSri LankaSt. LuciaSt. Vincent and the GrenadinesSudanSwazilandSwedenSwitzerlandSyrian Arab RepublicTajikistanTanzaniaThailandTrinidad and TobagoTunisiaTurkeyTurkmenistanUgandaUkraineUnited Arab EmiratesUnited KingdomUnited StatesUpper middle incomeUruguayUzbekistanVenezuela, RBVietnamWorldYemen, Rep.ZambiaZimbabwe Linea del tempo:
Questa scala temporale mostra un grafico dal 1964 anno al 2015 anno. Iran, Islamic Rep.. I dati fino ad 1963 anno non disponibili. Il numero di osservazioni attuali secondo i date: 51.
La fonte (nome):
Indicatori dello sviluppo mondiale
La fonte (organizzazione):
World Intellectual Property Organization (WIPO), WIPO Patent Report: Statistics on Worldwide Patent Activity. The International Bureau of WIPO assumes no responsibility with respect to the transformation of these data.
Categorie:
Science & Technology
sono stati aggiornati
23 apr 2017 anni
Indicatori delle variazioni dei valori per anni
Minima:
115.0
1 gen 1998 anni
Massimo:
2.945 Mille.
1 gen 1976 anni
Alla data di osservazione
Valore
Variazione assoluta
La variazione rispetto al valore precedente
1 gen 1964 anni
276.0
+276.0
0.0%
1 gen 1965 anni
408.0
+132.0
47.83%
1 gen 1966 anni
466.0
+58.0
14.22%
1 gen 1967 anni
492.0
+26.0
5.58%
1 gen 1968 anni
616.0
+124.0
25.2%
1 gen 1969 anni
640.0
+24.0
3.9%
1 gen 1970 anni
761.0
+121.0
18.91%
1 gen 1971 anni
710.0
-51.0
-6.7%
1 gen 1972 anni
627.0
-83.0
-11.69%
1 gen 1973 anni
681.0
+54.0
8.61%
1 gen 1974 anni
784.0
+103.0
15.12%
1 gen 1975 anni
1.283 Mille.
+499.0
63.65%
1 gen 1976 anni
2.945 Mille.
+1.662 Mille.
129.54%
1 gen 1977 anni
1.937 Mille.
-1.008 Mille.
-34.23%
1 gen 1978 anni
1.687 Mille.
-250.0
-12.91%
1 gen 1979 anni
1.667 Mille.
-20.0
-1.19%
1 gen 1980 anni
756.0
-911.0
-54.65%
1 gen 1981 anni
493.0
-263.0
-34.79%
1 gen 1982 anni
321.0
-172.0
-34.89%
1 gen 1983 anni
273.0
-48.0
-14.95%
1 gen 1984 anni
280.0
+7.0
2.56%
1 gen 1985 anni
312.0
+32.0
11.43%
1 gen 1986 anni
223.0
-89.0
-28.53%
1 gen 1988 anni
165.0
-58.0
-26.01%
1 gen 1989 anni
173.0
+8.0
4.85%
1 gen 1990 anni
170.0
-3.0
-1.73%
1 gen 1991 anni
173.0
+3.0
1.76%
1 gen 1992 anni
165.0
-8.0
-4.62%
1 gen 1993 anni
175.0
+10.0
6.06%
1 gen 1994 anni
164.0
-11.0
-6.29%
1 gen 1995 anni
131.0
-33.0
-20.12%
1 gen 1996 anni
129.0
-2.0
-1.53%
1 gen 1997 anni
227.0
+98.0
75.97%
1 gen 1998 anni
115.0
-112.0
-49.34%
1 gen 1999 anni
159.0
+44.0
38.26%
1 gen 2000 anni
177.0
+18.0
11.32%
1 gen 2001 anni
206.0
+29.0
16.38%
1 gen 2002 anni
302.0
+96.0
46.6%
1 gen 2003 anni
285.0
-17.0
-5.63%
1 gen 2004 anni
355.0
+70.0
24.56%
1 gen 2005 anni
356.0
+1.0
0.28%
1 gen 2006 anni
443.0
+87.0
24.44%
1 gen 2007 anni
557.0
+114.0
25.73%
1 gen 2008 anni
502.0
-55.0
-9.87%
1 gen 2009 anni
552.0
+50.0
9.96%
1 gen 2010 anni
516.0
-36.0
-6.52%
1 gen 2011 anni
528.0
+12.0
2.33%
1 gen 2012 anni
489.0
-39.0
-7.39%
1 gen 2013 anni
432.0
-57.0
-11.66%
1 gen 2014 anni
338.0
-94.0
-21.76%
1 gen 2015 anni
119.0
-219.0
-64.79%
Classificazione dei paesi secondo i statistiche attuali per anni


Commenti: