29
/it/
it
AIzaSyAYiBZKx7MnpbEhh9jyipgxe19OcubqV5w
April 1, 2024
208297
Netherlands
NLD
true
2
1
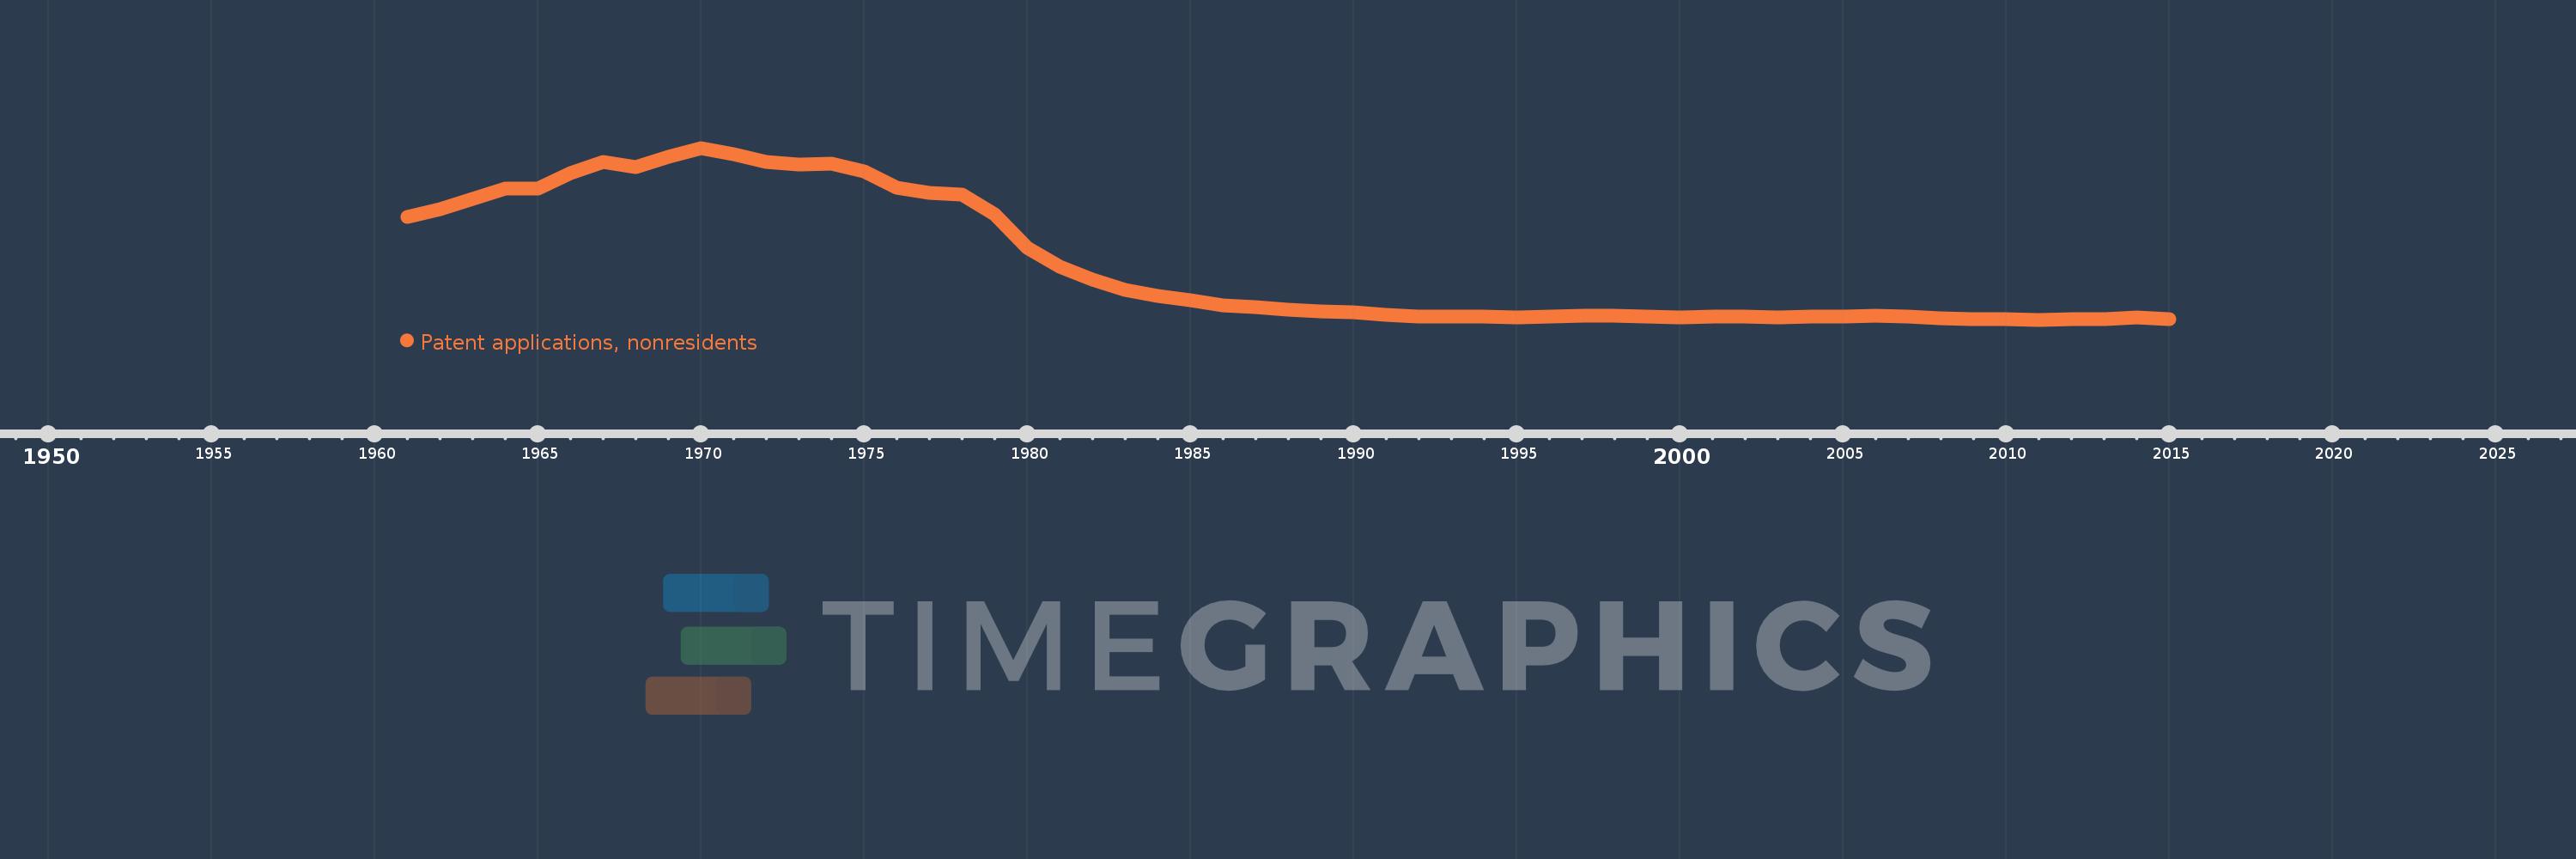
Patent applications, nonresidents
2015,2014,2013,2012,2011,2010,2009,2008,2007,2006,2005,2004,2003,2002,2001,2000,1999,1998,1997,1996,1995,1994,1993,1992,1991,1990,1989,1988,1987,1986,1985,1984,1983,1982,1981,1980,1979,1978,1977,1976,1975,1974,1973,1972,1971,1970,1969,1968,1967,1966,1965,1964,1962,1961
Queste statistiche in altri paesi:
AlbaniaAlgeriaAngolaAntigua and BarbudaArab WorldArgentinaArmeniaAustraliaAustriaAzerbaijanBahamas, TheBahrainBangladeshBarbadosBelarusBelgiumBelizeBhutanBoliviaBosnia and HerzegovinaBotswanaBrazilBrunei DarussalamBulgariaBurundiCambodiaCanadaCaribbean small statesCentral Europe and the BalticsChileChinaColombiaCongo, Dem. Rep.Congo, Rep.Costa RicaCote d'IvoireCroatiaCubaCyprusCzech RepublicDenmarkDjiboutiDominicaDominican RepublicEarly-demographic dividendEast Asia & PacificEast Asia & Pacific (excluding high income)East Asia & Pacific (IDA & IBRD countries)EcuadorEgypt, Arab Rep.El SalvadorEstoniaEthiopiaEuro areaEurope & Central AsiaEurope & Central Asia (excluding high income)Europe & Central Asia (IDA & IBRD countries)European UnionFijiFinlandFranceGambia, TheGeorgiaGermanyGhanaGreeceGrenadaGuatemalaGuyanaHaitiHigh incomeHondurasHong Kong SAR, ChinaHungaryIBRD onlyIcelandIDA & IBRD totalIDA blendIndiaIndonesiaIran, Islamic Rep.IraqIrelandIsraelItalyJamaicaJapanJordanKazakhstanKenyaKiribatiKorea, Dem. People’s Rep.Korea, Rep.KuwaitKyrgyz RepublicLao PDRLate-demographic dividendLatin America & Caribbean Latin America & Caribbean (excluding high income)Latin America & the Caribbean (IDA & IBRD countries)LatviaLebanonLesothoLiberiaLibyaLithuaniaLow & middle incomeLower middle incomeLuxembourgMacao SAR, ChinaMacedonia, FYRMadagascarMalawiMalaysiaMaliMaltaMauritiusMexicoMiddle East & North AfricaMiddle East & North Africa (excluding high income)Middle East & North Africa (IDA & IBRD countries)Middle incomeMoldovaMonacoMongoliaMontenegroMoroccoMozambiqueNamibiaNepalNetherlandsNew ZealandNicaraguaNigeriaNorth AmericaNorwayOECD membersPacific island small statesPakistanPanamaPapua New GuineaParaguayPeruPhilippinesPolandPortugalPost-demographic dividendQatarRomaniaRussian FederationRwandaSamoaSao Tome and PrincipeSaudi ArabiaSerbiaSeychellesSierra LeoneSingaporeSlovak RepublicSloveniaSolomon IslandsSomaliaSouth AfricaSouth AsiaSouth Asia (IDA & IBRD)SpainSri LankaSt. LuciaSt. Vincent and the GrenadinesSudanSwazilandSwedenSwitzerlandSyrian Arab RepublicTajikistanTanzaniaThailandTrinidad and TobagoTunisiaTurkeyTurkmenistanUgandaUkraineUnited Arab EmiratesUnited KingdomUnited StatesUpper middle incomeUruguayUzbekistanVenezuela, RBVietnamWorldYemen, Rep.ZambiaZimbabwe Linea del tempo:
Questa scala temporale mostra un grafico dal 1961 anno al 2015 anno. Netherlands. I dati fino ad 1960 anno non disponibili. Il numero di osservazioni attuali secondo i date: 54.
La fonte (nome):
Indicatori dello sviluppo mondiale
La fonte (organizzazione):
World Intellectual Property Organization (WIPO), WIPO Patent Report: Statistics on Worldwide Patent Activity. The International Bureau of WIPO assumes no responsibility with respect to the transformation of these data.
Categorie:
Science & Technology
sono stati aggiornati
23 apr 2017 anni
Indicatori delle variazioni dei valori per anni
Minima:
240.0
1 gen 2011 anni
Massimo:
17.269 Mille.
1 gen 1970 anni
Alla data di osservazione
Valore
Variazione assoluta
La variazione rispetto al valore precedente
1 gen 1961 anni
10.409 Mille.
+10.409 Mille.
0.0%
1 gen 1962 anni
11.159 Mille.
+750.0
7.21%
1 gen 1964 anni
13.225 Mille.
+2.066 Mille.
18.51%
1 gen 1965 anni
13.206 Mille.
-19.0
-0.14%
1 gen 1966 anni
14.779 Mille.
+1.573 Mille.
11.91%
1 gen 1967 anni
15.894 Mille.
+1.115 Mille.
7.54%
1 gen 1968 anni
15.401 Mille.
-493.0
-3.1%
1 gen 1969 anni
16.42 Mille.
+1.019 Mille.
6.62%
1 gen 1970 anni
17.269 Mille.
+849.0
5.17%
1 gen 1971 anni
16.647 Mille.
-622.0
-3.6%
1 gen 1972 anni
15.912 Mille.
-735.0
-4.42%
1 gen 1973 anni
15.589 Mille.
-323.0
-2.03%
1 gen 1974 anni
15.728 Mille.
+139.0
0.89%
1 gen 1975 anni
14.966 Mille.
-762.0
-4.84%
1 gen 1976 anni
13.301 Mille.
-1.665 Mille.
-11.13%
1 gen 1977 anni
12.782 Mille.
-519.0
-3.9%
1 gen 1978 anni
12.669 Mille.
-113.0
-0.88%
1 gen 1979 anni
10.669 Mille.
-2.0 Mille.
-15.79%
1 gen 1980 anni
7.384 Mille.
-3.285 Mille.
-30.79%
1 gen 1981 anni
5.532 Mille.
-1.852 Mille.
-25.08%
1 gen 1982 anni
4.228 Mille.
-1.304 Mille.
-23.57%
1 gen 1983 anni
3.212 Mille.
-1.016 Mille.
-24.03%
1 gen 1984 anni
2.611 Mille.
-601.0
-18.71%
1 gen 1985 anni
2.139 Mille.
-472.0
-18.08%
1 gen 1986 anni
1.658 Mille.
-481.0
-22.49%
1 gen 1987 anni
1.464 Mille.
-194.0
-11.7%
1 gen 1988 anni
1.201 Mille.
-263.0
-17.96%
1 gen 1989 anni
1.068 Mille.
-133.0
-11.07%
1 gen 1990 anni
993.0
-75.0
-7.02%
1 gen 1991 anni
764.0
-229.0
-23.06%
1 gen 1992 anni
595.0
-169.0
-22.12%
1 gen 1993 anni
555.0
-40.0
-6.72%
1 gen 1994 anni
560.0
+5.0
0.9%
1 gen 1995 anni
501.0
-59.0
-10.54%
1 gen 1996 anni
569.0
+68.0
13.57%
1 gen 1997 anni
633.0
+64.0
11.25%
1 gen 1998 anni
637.0
+4.0
0.63%
1 gen 1999 anni
549.0
-88.0
-13.81%
1 gen 2000 anni
506.0
-43.0
-7.83%
1 gen 2001 anni
529.0
+23.0
4.55%
1 gen 2002 anni
543.0
+14.0
2.65%
1 gen 2003 anni
481.0
-62.0
-11.42%
1 gen 2004 anni
573.0
+92.0
19.13%
1 gen 2005 anni
556.0
-17.0
-2.97%
1 gen 2006 anni
633.0
+77.0
13.85%
1 gen 2007 anni
548.0
-85.0
-13.43%
1 gen 2008 anni
367.0
-181.0
-33.03%
1 gen 2009 anni
311.0
-56.0
-15.26%
1 gen 2010 anni
279.0
-32.0
-10.29%
1 gen 2011 anni
240.0
-39.0
-13.98%
1 gen 2012 anni
310.0
+70.0
29.17%
1 gen 2013 anni
338.0
+28.0
9.03%
1 gen 2014 anni
449.0
+111.0
32.84%
1 gen 2015 anni
288.0
-161.0
-35.86%
Classificazione dei paesi secondo i statistiche attuali per anni


Commenti: