29
/it/
it
AIzaSyAYiBZKx7MnpbEhh9jyipgxe19OcubqV5w
April 1, 2024
210848
Nicaragua
NIC
true
2
1
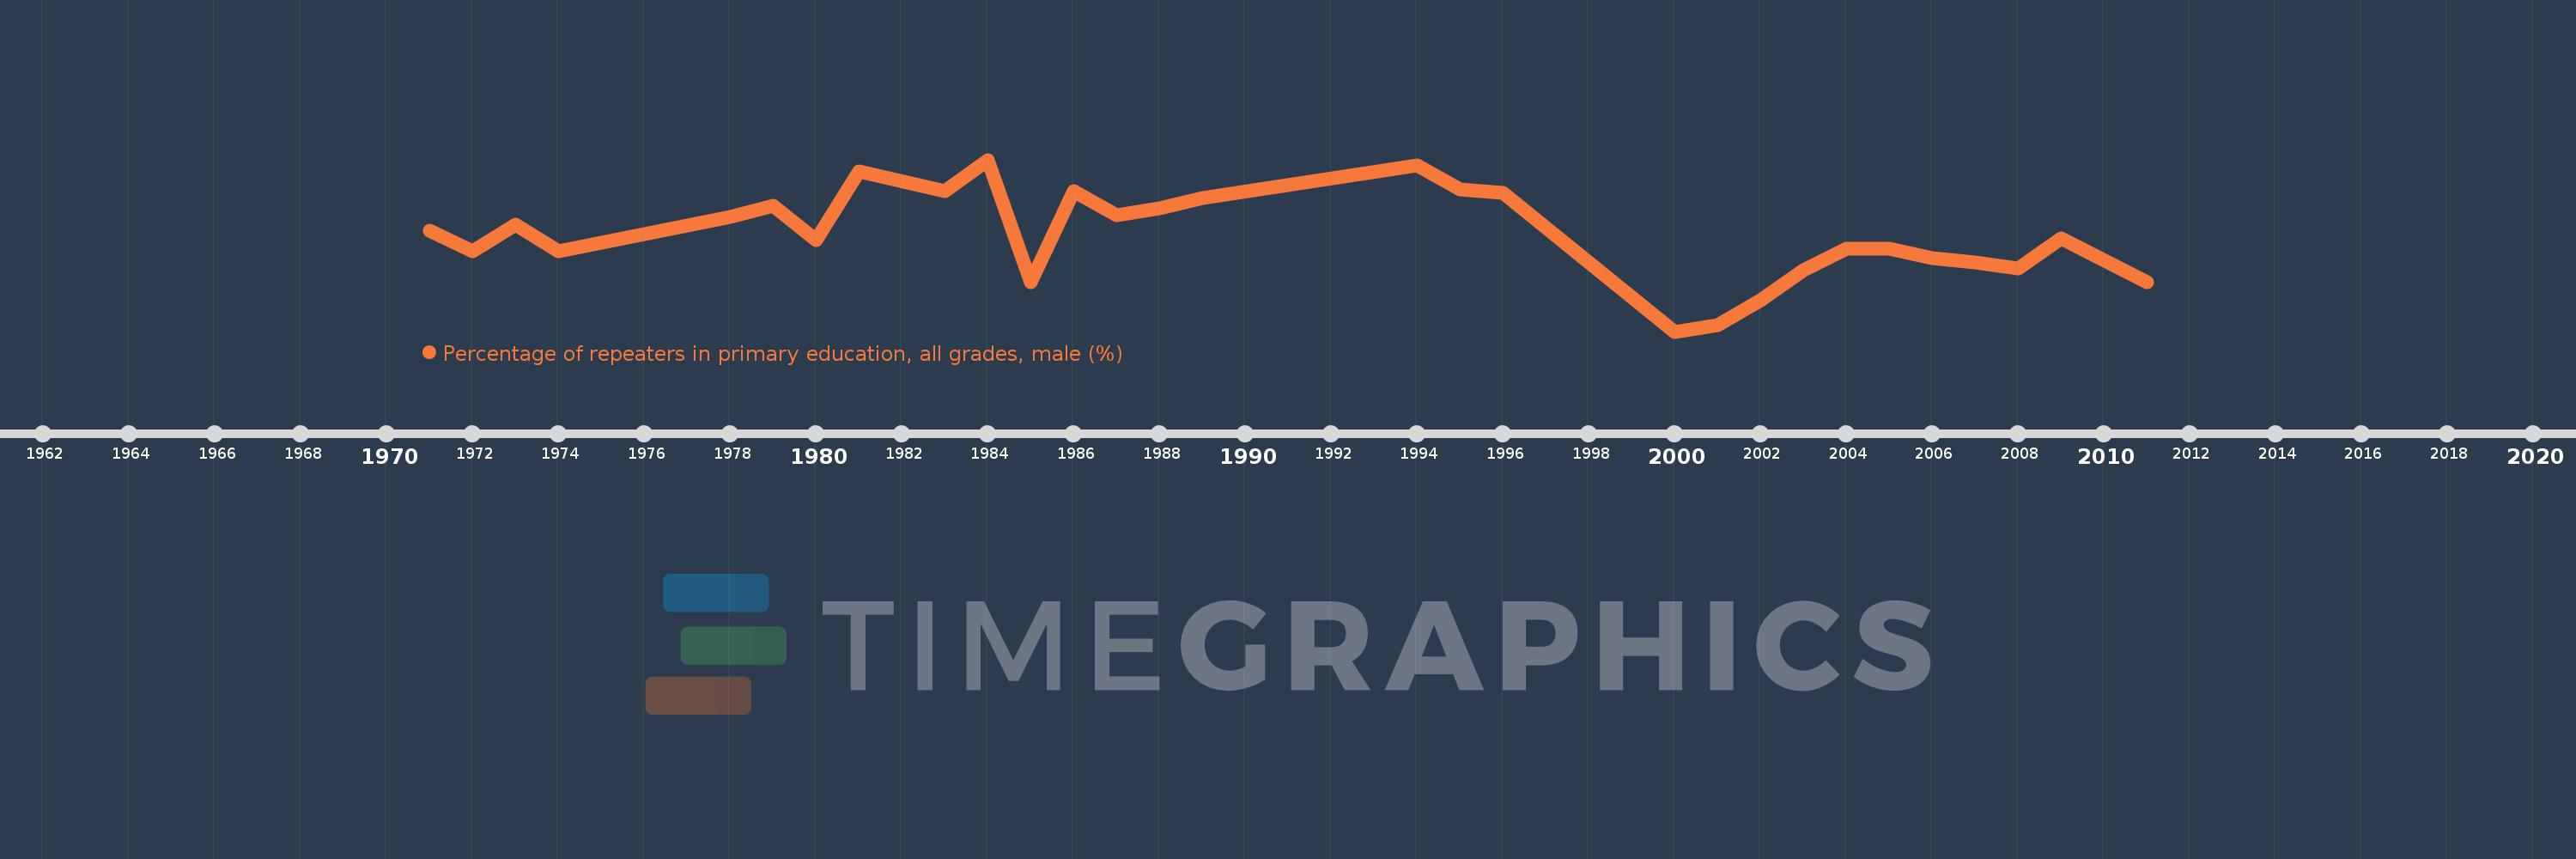
Percentage of repeaters in primary education, all grades, male (%)
2011,2009,2008,2007,2006,2005,2004,2003,2002,2001,2000,1996,1995,1994,1989,1988,1987,1986,1985,1984,1983,1981,1980,1979,1978,1974,1973,1972,1971
Queste statistiche in altri paesi:
AfghanistanAlbaniaAlgeriaAndorraAngolaAntigua and BarbudaArab WorldArgentinaArmeniaArubaAustriaAzerbaijanBahamas, TheBahrainBangladeshBelarusBelgiumBelizeBeninBermudaBhutanBoliviaBosnia and HerzegovinaBotswanaBrazilBritish Virgin IslandsBrunei DarussalamBulgariaBurkina FasoBurundiCabo VerdeCambodiaCameroonCanadaCaribbean small statesCayman IslandsCentral African RepublicCentral Europe and the BalticsChadChileChinaColombiaComorosCongo, Dem. Rep.Congo, Rep.Costa RicaCote d'IvoireCroatiaCubaCyprusCzech RepublicDenmarkDjiboutiDominicaDominican RepublicEarly-demographic dividendEast Asia & PacificEast Asia & Pacific (excluding high income)East Asia & Pacific (IDA & IBRD countries)EcuadorEgypt, Arab Rep.El SalvadorEquatorial GuineaEritreaEstoniaEthiopiaEuro areaEurope & Central AsiaEurope & Central Asia (excluding high income)Europe & Central Asia (IDA & IBRD countries)European UnionFijiFinlandFragile and conflict affected situationsFranceGabonGambia, TheGeorgiaGermanyGhanaGreeceGrenadaGuatemalaGuineaGuinea-BissauGuyanaHaitiHeavily indebted poor countries (HIPC)High incomeHondurasHong Kong SAR, ChinaHungaryIBRD onlyIcelandIDA & IBRD totalIDA blendIDA onlyIDA totalIndiaIndonesiaIran, Islamic Rep.IraqIrelandIsraelItalyJamaicaJapanJordanKazakhstanKenyaKiribatiKorea, Rep.KuwaitKyrgyz RepublicLao PDRLate-demographic dividendLatin America & Caribbean Latin America & Caribbean (excluding high income)Latin America & the Caribbean (IDA & IBRD countries)LatviaLeast developed countries: UN classificationLebanonLesothoLiberiaLibyaLiechtensteinLithuaniaLow & middle incomeLow incomeLower middle incomeLuxembourgMacao SAR, ChinaMacedonia, FYRMadagascarMalawiMalaysiaMaldivesMaliMaltaMauritaniaMauritiusMexicoMiddle East & North AfricaMiddle East & North Africa (excluding high income)Middle East & North Africa (IDA & IBRD countries)Middle incomeMoldovaMonacoMongoliaMontenegroMoroccoMozambiqueMyanmarNamibiaNauruNepalNetherlandsNew ZealandNicaraguaNigerNorwayOECD membersOmanOther small statesPacific island small statesPakistanPalauPanamaPapua New GuineaParaguayPeruPhilippinesPolandPortugalPost-demographic dividendPre-demographic dividendQatarRomaniaRussian FederationRwandaSamoaSan MarinoSao Tome and PrincipeSaudi ArabiaSenegalSerbiaSeychellesSierra LeoneSingaporeSint Maarten (Dutch part)Slovak RepublicSloveniaSmall statesSolomon IslandsSomaliaSouth AfricaSouth AsiaSouth Asia (IDA & IBRD)South SudanSpainSri LankaSt. Kitts and NevisSt. LuciaSt. Vincent and the GrenadinesSub-Saharan Africa Sub-Saharan Africa (excluding high income)Sub-Saharan Africa (IDA & IBRD countries)SudanSurinameSwazilandSwedenSwitzerlandSyrian Arab RepublicTajikistanTanzaniaThailandTimor-LesteTogoTongaTrinidad and TobagoTunisiaTurkeyTurks and Caicos IslandsTuvaluUgandaUkraineUnited Arab EmiratesUnited KingdomUpper middle incomeUruguayUzbekistanVanuatuVenezuela, RBVietnamWest Bank and GazaWorldYemen, Rep.ZambiaZimbabwe Linea del tempo:
Questa scala temporale mostra un grafico dal 1971 anno al 2011 anno. Nicaragua. I dati fino ad 1970 anno non disponibili. Il numero di osservazioni attuali secondo i date: 29.
La fonte (nome):
Indicatori dello sviluppo mondiale
La fonte (organizzazione):
UNESCO Institute for Statistics
Categorie:
Education, Gender
sono stati aggiornati
23 apr 2017 anni
Indicatori delle variazioni dei valori per anni
Minima:
5.318
1 gen 2000 anni
Massimo:
18.752
1 gen 1984 anni
Alla data di osservazione
Valore
Variazione assoluta
La variazione rispetto al valore precedente
1 gen 1971 anni
13.198
+13.198
0.0%
1 gen 1972 anni
11.575
-1.623
-12.29%
1 gen 1973 anni
13.66
+2.085
18.01%
1 gen 1974 anni
11.616
-2.045
-14.97%
1 gen 1978 anni
14.309
+2.693
23.19%
1 gen 1979 anni
15.146
+0.838
5.85%
1 gen 1980 anni
12.479
-2.667
-17.61%
1 gen 1981 anni
17.862
+5.383
43.14%
1 gen 1983 anni
16.302
-1.56
-8.73%
1 gen 1984 anni
18.752
+2.449
15.02%
1 gen 1985 anni
9.148
-9.603
-51.21%
1 gen 1986 anni
16.268
+7.12
77.83%
1 gen 1987 anni
14.443
-1.825
-11.22%
1 gen 1988 anni
14.981
+0.538
3.73%
1 gen 1989 anni
15.78
+0.798
5.33%
1 gen 1994 anni
18.332
+2.552
16.17%
1 gen 1995 anni
16.431
-1.901
-10.37%
1 gen 1996 anni
16.134
-0.298
-1.81%
1 gen 2000 anni
5.318
-10.815
-67.04%
1 gen 2001 anni
5.843
+0.524
9.86%
1 gen 2002 anni
7.737
+1.894
32.41%
1 gen 2003 anni
10.127
+2.391
30.9%
1 gen 2004 anni
11.799
+1.672
16.51%
1 gen 2005 anni
11.792
-0.007
-0.06%
1 gen 2006 anni
11.072
-0.721
-6.11%
1 gen 2007 anni
10.754
-0.317
-2.87%
1 gen 2008 anni
10.239
-0.515
-4.79%
1 gen 2009 anni
12.584
+2.345
22.9%
1 gen 2011 anni
9.212
-3.372
-26.8%
Classificazione dei paesi secondo i statistiche attuali per anni


Commenti: