29
/it/
it
AIzaSyAYiBZKx7MnpbEhh9jyipgxe19OcubqV5w
April 1, 2024
194709
Mauritius
MUS
true
2
1
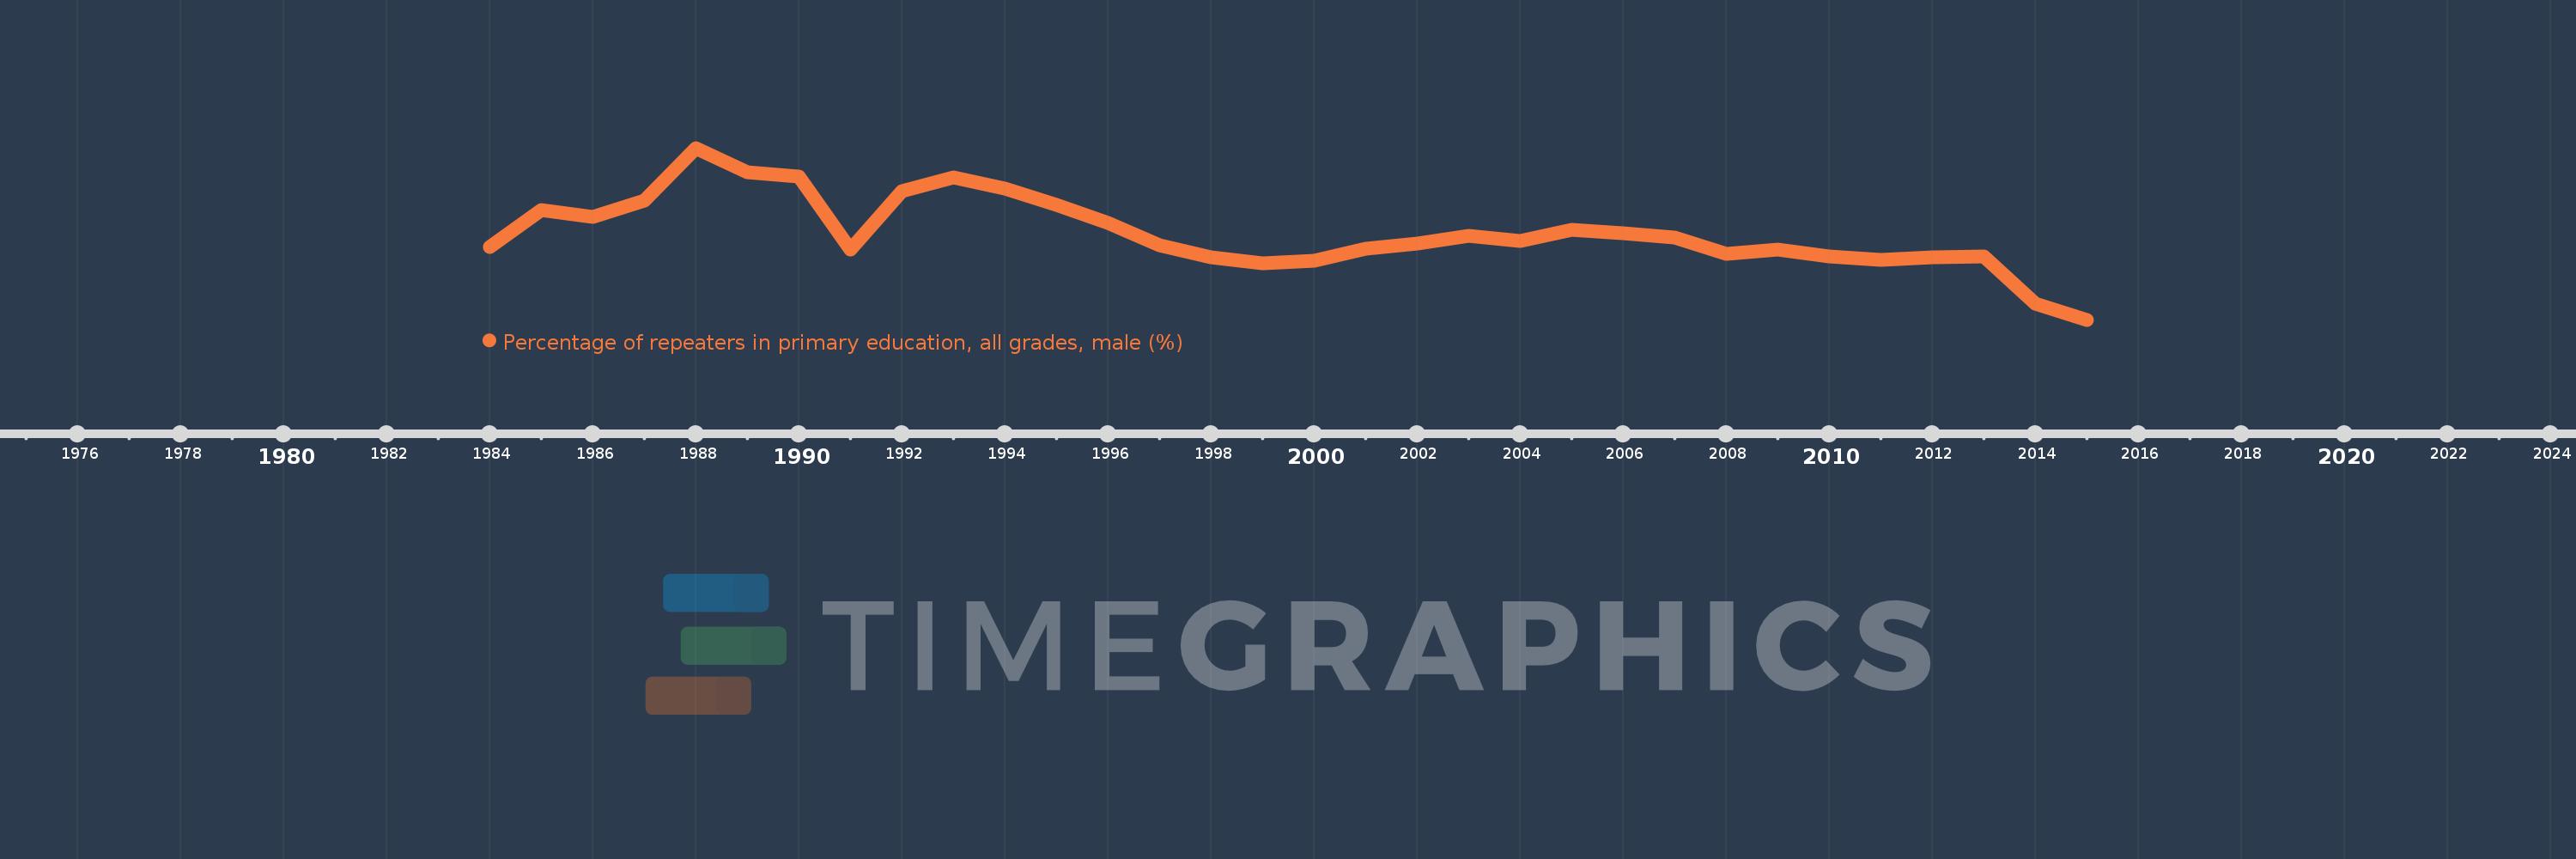
Percentage of repeaters in primary education, all grades, male (%)
2015,2014,2013,2012,2011,2010,2009,2008,2007,2006,2005,2004,2003,2002,2001,2000,1999,1998,1997,1996,1995,1994,1993,1992,1991,1990,1989,1988,1987,1986,1985,1984
Queste statistiche in altri paesi:
AfghanistanAlbaniaAlgeriaAndorraAngolaAntigua and BarbudaArab WorldArgentinaArmeniaArubaAustriaAzerbaijanBahamas, TheBahrainBangladeshBelarusBelgiumBelizeBeninBermudaBhutanBoliviaBosnia and HerzegovinaBotswanaBrazilBritish Virgin IslandsBrunei DarussalamBulgariaBurkina FasoBurundiCabo VerdeCambodiaCameroonCanadaCaribbean small statesCayman IslandsCentral African RepublicCentral Europe and the BalticsChadChileChinaColombiaComorosCongo, Dem. Rep.Congo, Rep.Costa RicaCote d'IvoireCroatiaCubaCyprusCzech RepublicDenmarkDjiboutiDominicaDominican RepublicEarly-demographic dividendEast Asia & PacificEast Asia & Pacific (excluding high income)East Asia & Pacific (IDA & IBRD countries)EcuadorEgypt, Arab Rep.El SalvadorEquatorial GuineaEritreaEstoniaEthiopiaEuro areaEurope & Central AsiaEurope & Central Asia (excluding high income)Europe & Central Asia (IDA & IBRD countries)European UnionFijiFinlandFragile and conflict affected situationsFranceGabonGambia, TheGeorgiaGermanyGhanaGreeceGrenadaGuatemalaGuineaGuinea-BissauGuyanaHaitiHeavily indebted poor countries (HIPC)High incomeHondurasHong Kong SAR, ChinaHungaryIBRD onlyIcelandIDA & IBRD totalIDA blendIDA onlyIDA totalIndiaIndonesiaIran, Islamic Rep.IraqIrelandIsraelItalyJamaicaJapanJordanKazakhstanKenyaKiribatiKorea, Rep.KuwaitKyrgyz RepublicLao PDRLate-demographic dividendLatin America & Caribbean Latin America & Caribbean (excluding high income)Latin America & the Caribbean (IDA & IBRD countries)LatviaLeast developed countries: UN classificationLebanonLesothoLiberiaLibyaLiechtensteinLithuaniaLow & middle incomeLow incomeLower middle incomeLuxembourgMacao SAR, ChinaMacedonia, FYRMadagascarMalawiMalaysiaMaldivesMaliMaltaMauritaniaMauritiusMexicoMiddle East & North AfricaMiddle East & North Africa (excluding high income)Middle East & North Africa (IDA & IBRD countries)Middle incomeMoldovaMonacoMongoliaMontenegroMoroccoMozambiqueMyanmarNamibiaNauruNepalNetherlandsNew ZealandNicaraguaNigerNorwayOECD membersOmanOther small statesPacific island small statesPakistanPalauPanamaPapua New GuineaParaguayPeruPhilippinesPolandPortugalPost-demographic dividendPre-demographic dividendQatarRomaniaRussian FederationRwandaSamoaSan MarinoSao Tome and PrincipeSaudi ArabiaSenegalSerbiaSeychellesSierra LeoneSingaporeSint Maarten (Dutch part)Slovak RepublicSloveniaSmall statesSolomon IslandsSomaliaSouth AfricaSouth AsiaSouth Asia (IDA & IBRD)South SudanSpainSri LankaSt. Kitts and NevisSt. LuciaSt. Vincent and the GrenadinesSub-Saharan Africa Sub-Saharan Africa (excluding high income)Sub-Saharan Africa (IDA & IBRD countries)SudanSurinameSwazilandSwedenSwitzerlandSyrian Arab RepublicTajikistanTanzaniaThailandTimor-LesteTogoTongaTrinidad and TobagoTunisiaTurkeyTurks and Caicos IslandsTuvaluUgandaUkraineUnited Arab EmiratesUnited KingdomUpper middle incomeUruguayUzbekistanVanuatuVenezuela, RBVietnamWest Bank and GazaWorldYemen, Rep.ZambiaZimbabwe Linea del tempo:
Questa scala temporale mostra un grafico dal 1984 anno al 2015 anno. Mauritius. I dati fino ad 1983 anno non disponibili. Il numero di osservazioni attuali secondo i date: 32.
La fonte (nome):
Indicatori dello sviluppo mondiale
La fonte (organizzazione):
UNESCO Institute for Statistics
Categorie:
Education, Gender
sono stati aggiornati
23 apr 2017 anni
Indicatori delle variazioni dei valori per anni
Minima:
1.112
1 gen 2015 anni
Massimo:
9.691
1 gen 1988 anni
Alla data di osservazione
Valore
Variazione assoluta
La variazione rispetto al valore precedente
1 gen 1984 anni
4.75
+4.75
0.0%
1 gen 1985 anni
6.585
+1.834
38.62%
1 gen 1986 anni
6.236
-0.349
-5.3%
1 gen 1987 anni
7.067
+0.832
13.33%
1 gen 1988 anni
9.691
+2.624
37.13%
1 gen 1989 anni
8.492
-1.199
-12.37%
1 gen 1990 anni
8.245
-0.247
-2.91%
1 gen 1991 anni
4.632
-3.613
-43.82%
1 gen 1992 anni
7.55
+2.918
62.99%
1 gen 1993 anni
8.223
+0.672
8.9%
1 gen 1994 anni
7.68
-0.543
-6.6%
1 gen 1995 anni
6.858
-0.822
-10.7%
1 gen 1996 anni
5.945
-0.913
-13.31%
1 gen 1997 anni
4.835
-1.111
-18.68%
1 gen 1998 anni
4.248
-0.587
-12.14%
1 gen 1999 anni
3.948
-0.3
-7.06%
1 gen 2000 anni
4.079
+0.131
3.33%
1 gen 2001 anni
4.638
+0.559
13.7%
1 gen 2002 anni
4.937
+0.299
6.45%
1 gen 2003 anni
5.284
+0.347
7.03%
1 gen 2004 anni
5.026
-0.259
-4.9%
1 gen 2005 anni
5.601
+0.576
11.46%
1 gen 2006 anni
5.433
-0.169
-3.01%
1 gen 2007 anni
5.213
-0.219
-4.04%
1 gen 2008 anni
4.388
-0.825
-15.83%
1 gen 2009 anni
4.633
+0.245
5.58%
1 gen 2010 anni
4.279
-0.354
-7.65%
1 gen 2011 anni
4.106
-0.173
-4.04%
1 gen 2012 anni
4.247
+0.141
3.44%
1 gen 2013 anni
4.279
+0.032
0.75%
1 gen 2014 anni
1.896
-2.383
-55.7%
1 gen 2015 anni
1.112
-0.784
-41.35%
Classificazione dei paesi secondo i statistiche attuali per anni


Commenti: