29
/it/
it
AIzaSyAYiBZKx7MnpbEhh9jyipgxe19OcubqV5w
April 1, 2024
202047
Morocco
MAR
true
2
1
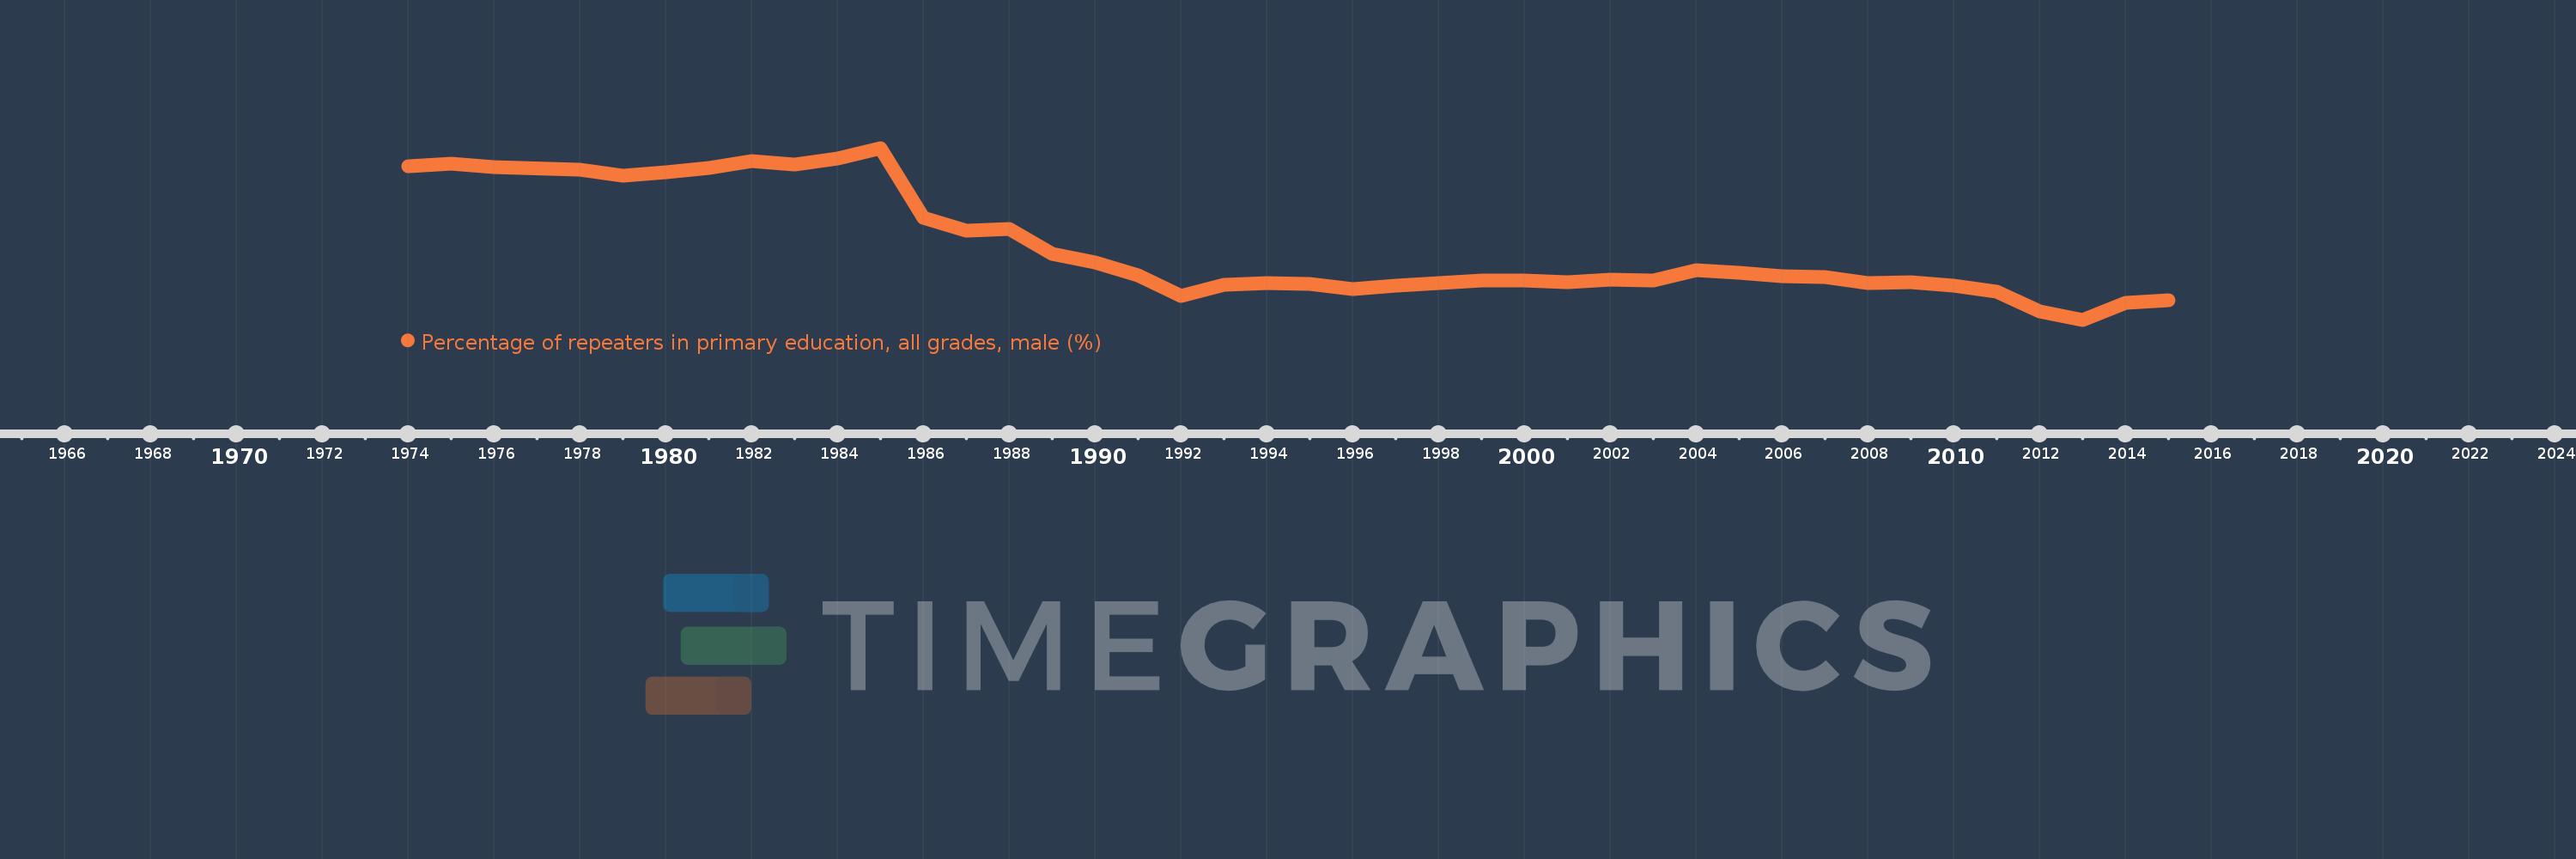
Percentage of repeaters in primary education, all grades, male (%)
2015,2014,2013,2012,2011,2010,2009,2008,2007,2006,2005,2004,2003,2002,2001,2000,1999,1998,1997,1996,1995,1994,1993,1992,1991,1990,1989,1988,1987,1986,1985,1984,1983,1982,1981,1980,1979,1978,1976,1975,1974
Queste statistiche in altri paesi:
AfghanistanAlbaniaAlgeriaAndorraAngolaAntigua and BarbudaArab WorldArgentinaArmeniaArubaAustriaAzerbaijanBahamas, TheBahrainBangladeshBelarusBelgiumBelizeBeninBermudaBhutanBoliviaBosnia and HerzegovinaBotswanaBrazilBritish Virgin IslandsBrunei DarussalamBulgariaBurkina FasoBurundiCabo VerdeCambodiaCameroonCanadaCaribbean small statesCayman IslandsCentral African RepublicCentral Europe and the BalticsChadChileChinaColombiaComorosCongo, Dem. Rep.Congo, Rep.Costa RicaCote d'IvoireCroatiaCubaCyprusCzech RepublicDenmarkDjiboutiDominicaDominican RepublicEarly-demographic dividendEast Asia & PacificEast Asia & Pacific (excluding high income)East Asia & Pacific (IDA & IBRD countries)EcuadorEgypt, Arab Rep.El SalvadorEquatorial GuineaEritreaEstoniaEthiopiaEuro areaEurope & Central AsiaEurope & Central Asia (excluding high income)Europe & Central Asia (IDA & IBRD countries)European UnionFijiFinlandFragile and conflict affected situationsFranceGabonGambia, TheGeorgiaGermanyGhanaGreeceGrenadaGuatemalaGuineaGuinea-BissauGuyanaHaitiHeavily indebted poor countries (HIPC)High incomeHondurasHong Kong SAR, ChinaHungaryIBRD onlyIcelandIDA & IBRD totalIDA blendIDA onlyIDA totalIndiaIndonesiaIran, Islamic Rep.IraqIrelandIsraelItalyJamaicaJapanJordanKazakhstanKenyaKiribatiKorea, Rep.KuwaitKyrgyz RepublicLao PDRLate-demographic dividendLatin America & Caribbean Latin America & Caribbean (excluding high income)Latin America & the Caribbean (IDA & IBRD countries)LatviaLeast developed countries: UN classificationLebanonLesothoLiberiaLibyaLiechtensteinLithuaniaLow & middle incomeLow incomeLower middle incomeLuxembourgMacao SAR, ChinaMacedonia, FYRMadagascarMalawiMalaysiaMaldivesMaliMaltaMauritaniaMauritiusMexicoMiddle East & North AfricaMiddle East & North Africa (excluding high income)Middle East & North Africa (IDA & IBRD countries)Middle incomeMoldovaMonacoMongoliaMontenegroMoroccoMozambiqueMyanmarNamibiaNauruNepalNetherlandsNew ZealandNicaraguaNigerNorwayOECD membersOmanOther small statesPacific island small statesPakistanPalauPanamaPapua New GuineaParaguayPeruPhilippinesPolandPortugalPost-demographic dividendPre-demographic dividendQatarRomaniaRussian FederationRwandaSamoaSan MarinoSao Tome and PrincipeSaudi ArabiaSenegalSerbiaSeychellesSierra LeoneSingaporeSint Maarten (Dutch part)Slovak RepublicSloveniaSmall statesSolomon IslandsSomaliaSouth AfricaSouth AsiaSouth Asia (IDA & IBRD)South SudanSpainSri LankaSt. Kitts and NevisSt. LuciaSt. Vincent and the GrenadinesSub-Saharan Africa Sub-Saharan Africa (excluding high income)Sub-Saharan Africa (IDA & IBRD countries)SudanSurinameSwazilandSwedenSwitzerlandSyrian Arab RepublicTajikistanTanzaniaThailandTimor-LesteTogoTongaTrinidad and TobagoTunisiaTurkeyTurks and Caicos IslandsTuvaluUgandaUkraineUnited Arab EmiratesUnited KingdomUpper middle incomeUruguayUzbekistanVanuatuVenezuela, RBVietnamWest Bank and GazaWorldYemen, Rep.ZambiaZimbabwe Linea del tempo:
Questa scala temporale mostra un grafico dal 1974 anno al 2015 anno. Morocco. I dati fino ad 1973 anno non disponibili. Il numero di osservazioni attuali secondo i date: 41.
La fonte (nome):
Indicatori dello sviluppo mondiale
La fonte (organizzazione):
UNESCO Institute for Statistics
Categorie:
Education, Gender
sono stati aggiornati
23 apr 2017 anni
Indicatori delle variazioni dei valori per anni
Minima:
8.753
1 gen 2013 anni
Massimo:
32.251
1 gen 1985 anni
Alla data di osservazione
Valore
Variazione assoluta
La variazione rispetto al valore precedente
1 gen 1974 anni
29.795
+29.795
0.0%
1 gen 1975 anni
30.145
+0.349
1.17%
1 gen 1976 anni
29.589
-0.555
-1.84%
1 gen 1978 anni
29.233
-0.356
-1.2%
1 gen 1979 anni
28.424
-0.81
-2.77%
1 gen 1980 anni
28.878
+0.455
1.6%
1 gen 1981 anni
29.496
+0.617
2.14%
1 gen 1982 anni
30.425
+0.929
3.15%
1 gen 1983 anni
29.99
-0.435
-1.43%
1 gen 1984 anni
30.77
+0.78
2.6%
1 gen 1985 anni
32.251
+1.481
4.81%
1 gen 1986 anni
22.746
-9.505
-29.47%
1 gen 1987 anni
20.887
-1.859
-8.17%
1 gen 1988 anni
21.179
+0.293
1.4%
1 gen 1989 anni
17.785
-3.394
-16.02%
1 gen 1990 anni
16.579
-1.207
-6.79%
1 gen 1991 anni
14.87
-1.709
-10.31%
1 gen 1992 anni
11.958
-2.912
-19.58%
1 gen 1993 anni
13.59
+1.632
13.65%
1 gen 1994 anni
13.734
+0.144
1.06%
1 gen 1995 anni
13.653
-0.081
-0.59%
1 gen 1996 anni
12.996
-0.657
-4.81%
1 gen 1997 anni
13.412
+0.416
3.2%
1 gen 1998 anni
13.816
+0.404
3.01%
1 gen 1999 anni
14.152
+0.336
2.43%
1 gen 2000 anni
14.124
-0.028
-0.2%
1 gen 2001 anni
13.862
-0.262
-1.86%
1 gen 2002 anni
14.225
+0.363
2.62%
1 gen 2003 anni
14.114
-0.111
-0.78%
1 gen 2004 anni
15.579
+1.466
10.38%
1 gen 2005 anni
15.172
-0.407
-2.61%
1 gen 2006 anni
14.746
-0.426
-2.81%
1 gen 2007 anni
14.564
-0.182
-1.23%
1 gen 2008 anni
13.732
-0.833
-5.72%
1 gen 2009 anni
13.895
+0.163
1.19%
1 gen 2010 anni
13.425
-0.47
-3.38%
1 gen 2011 anni
12.568
-0.858
-6.39%
1 gen 2012 anni
9.94
-2.628
-20.91%
1 gen 2013 anni
8.753
-1.186
-11.93%
1 gen 2014 anni
11.075
+2.321
26.52%
1 gen 2015 anni
11.397
+0.322
2.9%
Classificazione dei paesi secondo i statistiche attuali per anni


Commenti: