29
/it/
it
AIzaSyAYiBZKx7MnpbEhh9jyipgxe19OcubqV5w
April 1, 2024
181114
Lithuania
LTU
true
2
1
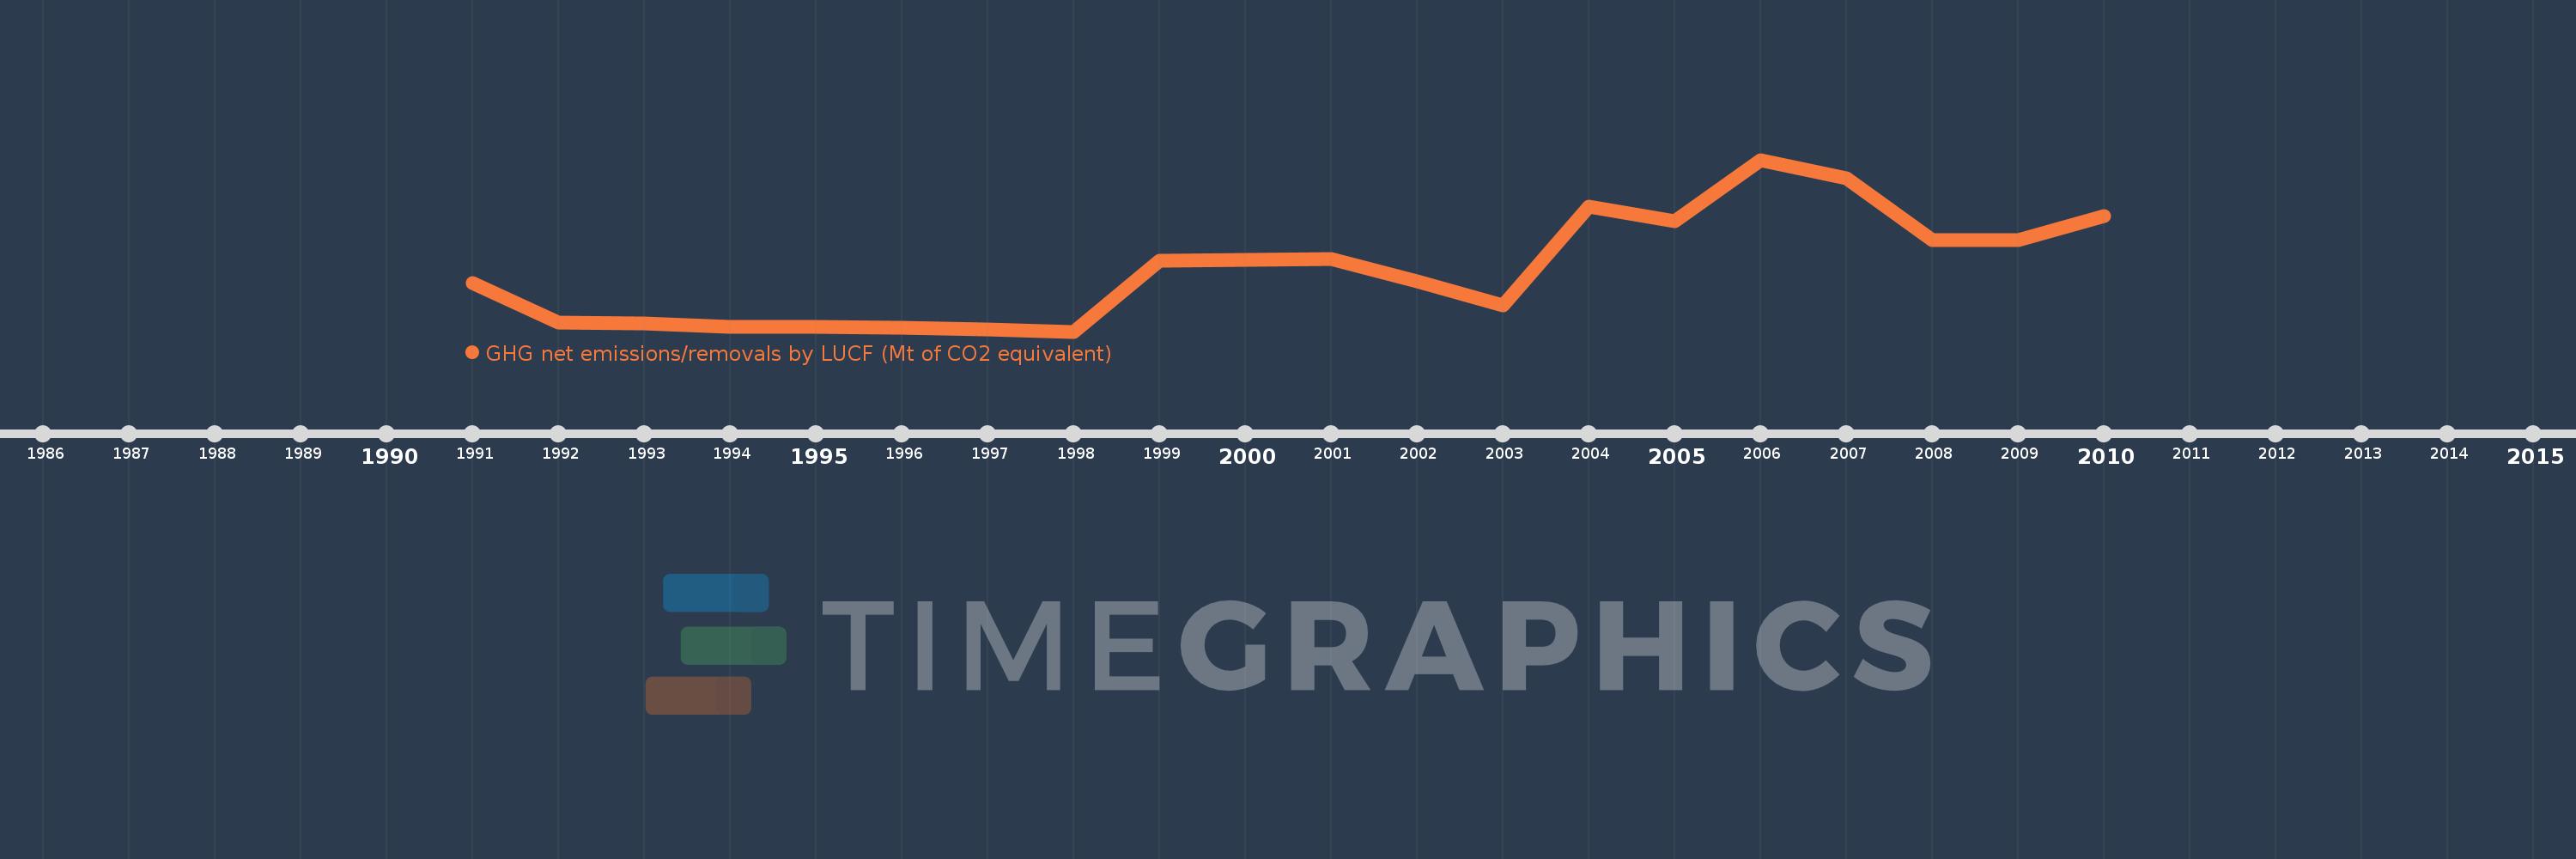
GHG net emissions/removals by LUCF (Mt of CO2 equivalent)
2010,2009,2008,2007,2006,2005,2004,2003,2002,2001,2000,1999,1998,1997,1996,1995,1994,1993,1992,1991
Queste statistiche in altri paesi:
AlbaniaAlgeriaAntigua and BarbudaArgentinaAustraliaAustriaAzerbaijanBangladeshBarbadosBelarusBelgiumBelizeBeninBhutanBoliviaBosnia and HerzegovinaBotswanaBrazilBulgariaBurkina FasoBurundiCabo VerdeCambodiaCameroonCanadaCentral African RepublicChadChileChinaColombiaComorosCongo, Dem. Rep.Congo, Rep.Costa RicaCote d'IvoireCroatiaCubaCzech RepublicDenmarkDjiboutiDominicaDominican RepublicEcuadorEgypt, Arab Rep.El SalvadorEritreaEstoniaEthiopiaFijiFinlandFranceGabonGambia, TheGeorgiaGermanyGhanaGreeceGrenadaGuatemalaGuineaGuyanaHaitiHondurasHungaryIcelandIndiaIndonesiaIran, Islamic Rep.IrelandIsraelItalyJamaicaJapanJordanKenyaKorea, Dem. People’s Rep.Korea, Rep.Kyrgyz RepublicLao PDRLatviaLebanonLesothoLiechtensteinLithuaniaLuxembourgMacedonia, FYRMadagascarMalawiMalaysiaMaliMaltaMauritaniaMauritiusMexicoMoldovaMonacoMongoliaMontenegroMoroccoMozambiqueNamibiaNauruNepalNetherlandsNew ZealandNicaraguaNigerNigeriaNorwayPakistanPanamaPapua New GuineaParaguayPeruPhilippinesPolandPortugalRomaniaRussian FederationRwandaSamoaSan MarinoSao Tome and PrincipeSaudi ArabiaSenegalSerbiaSeychellesSlovak RepublicSloveniaSouth AfricaSpainSri LankaSt. Kitts and NevisSt. LuciaSt. Vincent and the GrenadinesSudanSurinameSwazilandSwedenSwitzerlandTajikistanTanzaniaThailandTogoTongaTrinidad and TobagoTunisiaTurkeyTurkmenistanUgandaUkraineUnited Arab EmiratesUnited KingdomUnited StatesUruguayUzbekistanVanuatuVenezuela, RBVietnamYemen, Rep.ZambiaZimbabwe Linea del tempo:
Questa scala temporale mostra un grafico dal 1991 anno al 2010 anno. Lithuania. I dati fino ad 1990 anno non disponibili. Il numero di osservazioni attuali secondo i date: 20.
La fonte (nome):
Indicatori dello sviluppo mondiale
La fonte (organizzazione):
United Nations Framework Convention on Climate Change.
Categorie:
Climate Change, Environment
sono stati aggiornati
23 apr 2017 anni
Indicatori delle variazioni dei valori per anni
Minima:
-4.745
1 gen 1998 anni
Massimo:
-3.27
1 gen 2006 anni
Alla data di osservazione
Valore
Variazione assoluta
La variazione rispetto al valore precedente
1 gen 1991 anni
-4.331
-4.331
0.0%
1 gen 1992 anni
-4.671
-0.34
7.85%
1 gen 1993 anni
-4.678
-0.007
0.15%
1 gen 1994 anni
-4.702
-0.024
0.52%
1 gen 1995 anni
-4.702
+0.0
-0.01%
1 gen 1996 anni
-4.714
-0.012
0.26%
1 gen 1997 anni
-4.725
-0.012
0.25%
1 gen 1998 anni
-4.745
-0.019
0.41%
1 gen 1999 anni
-4.133
+0.611
-12.89%
1 gen 2000 anni
-4.129
+0.005
-0.11%
1 gen 2001 anni
-4.122
+0.007
-0.16%
1 gen 2002 anni
-4.316
-0.194
4.72%
1 gen 2003 anni
-4.52
-0.204
4.72%
1 gen 2004 anni
-3.672
+0.848
-18.77%
1 gen 2005 anni
-3.798
-0.126
3.43%
1 gen 2006 anni
-3.27
+0.527
-13.89%
1 gen 2007 anni
-3.432
-0.162
4.95%
1 gen 2008 anni
-3.96
-0.528
15.39%
1 gen 2009 anni
-3.958
+0.002
-0.05%
1 gen 2010 anni
-3.75
+0.208
-5.26%
Classificazione dei paesi secondo i statistiche attuali per anni


Commenti: