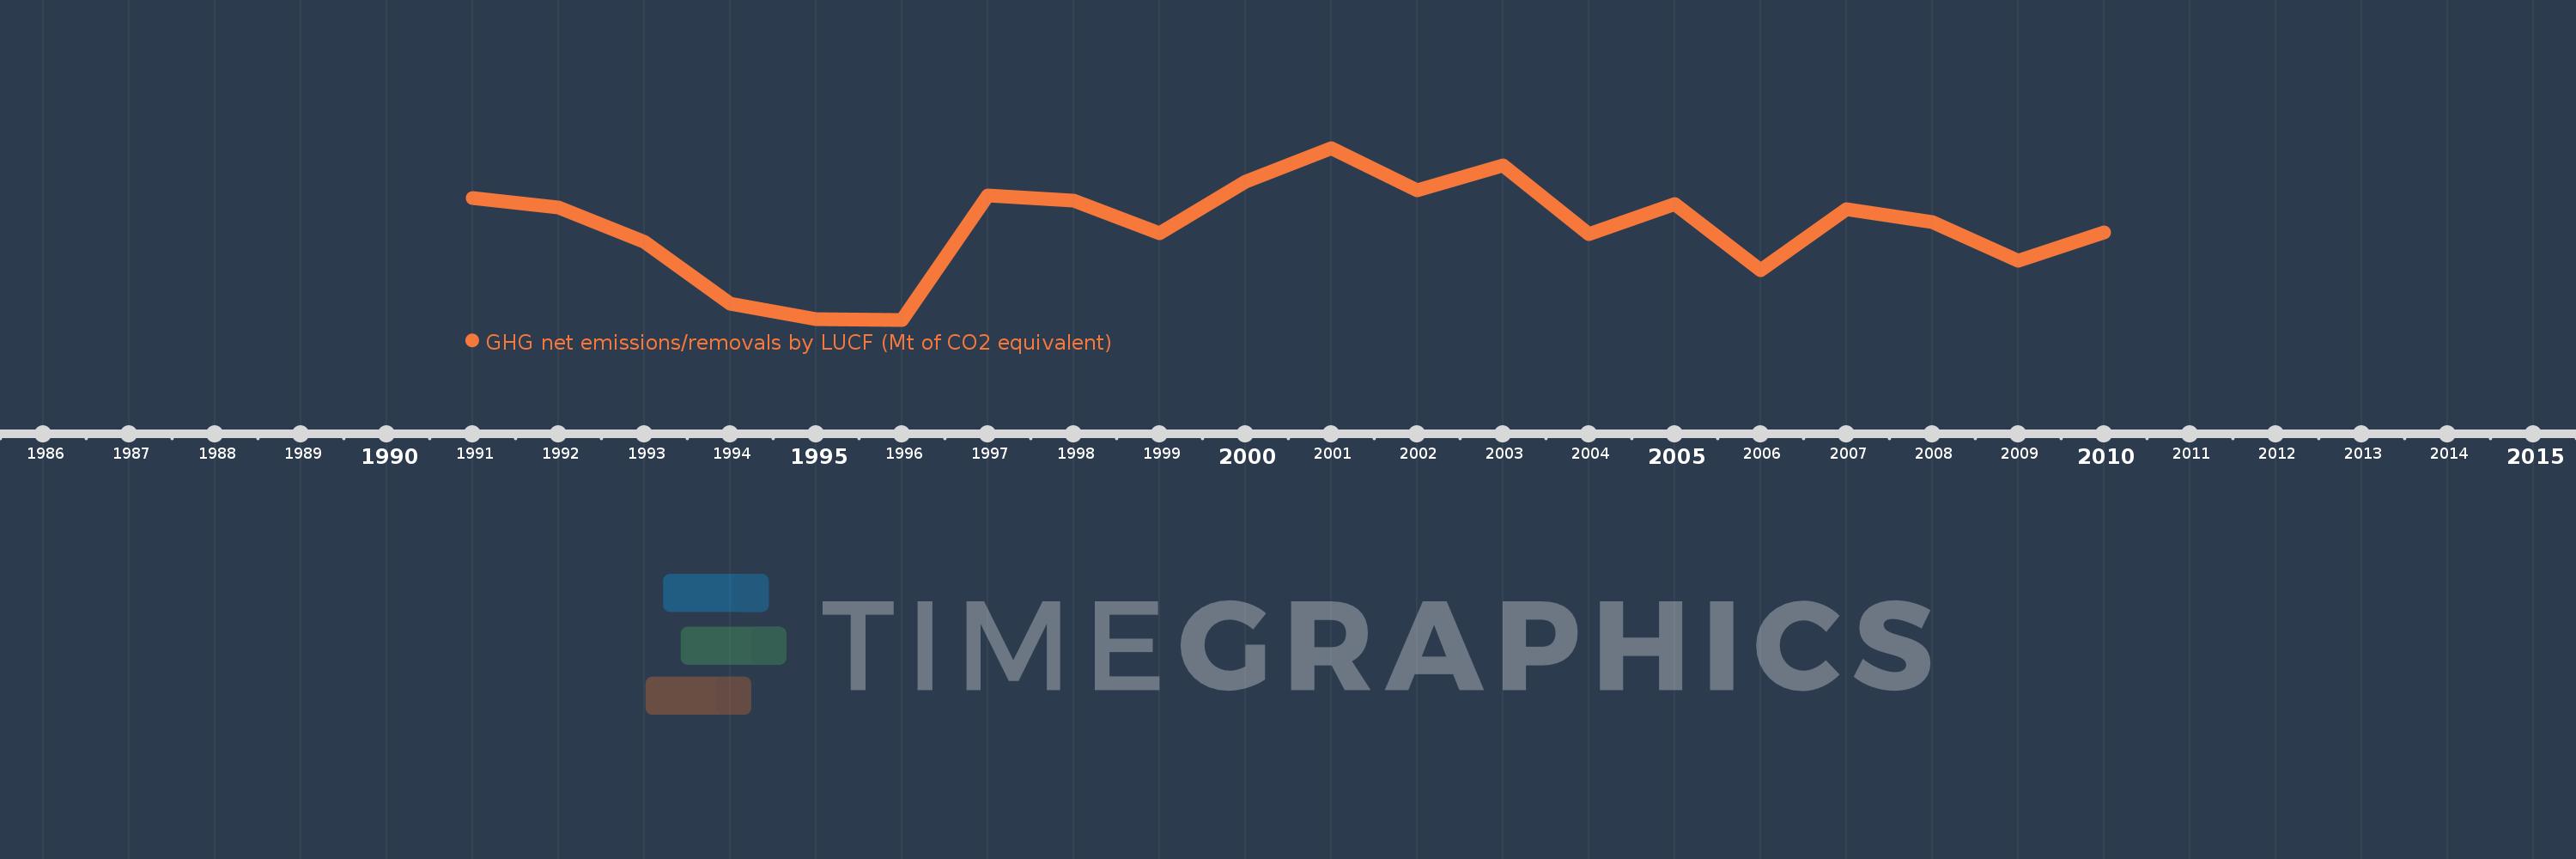
Questa scala temporale mostra un grafico dal 1991 anno al 2010 anno. Hungary. I dati fino ad 1990 anno non disponibili. Il numero di osservazioni attuali secondo i date: 20.
La fonte (nome):
Indicatori dello sviluppo mondiale
La fonte (organizzazione):
United Nations Framework Convention on Climate Change.
Categorie:
Climate Change, Environment
sono stati aggiornati
23 apr 2017 anni
Indicatori delle variazioni dei valori per anni
In media:
-2.853
Minima:
-5.781
1 gen 1996 anni
Massimo:
-0.364
1 gen 2001 anni
Alla data di osservazione
Valore
Variazione assoluta
La variazione rispetto al valore precedente
1 gen 1991 anni
-1.95
-1.95
0.0%
1 gen 1992 anni
-2.252
-0.302
15.51%
1 gen 1993 anni
-3.32
-1.068
47.43%
1 gen 1994 anni
-5.281
-1.961
59.05%
1 gen 1995 anni
-5.749
-0.468
8.87%
1 gen 1996 anni
-5.781
-0.032
0.56%
1 gen 1997 anni
-1.865
+3.917
-67.75%
1 gen 1998 anni
-2.034
-0.169
9.06%
1 gen 1999 anni
-3.064
-1.03
50.66%
1 gen 2000 anni
-1.433
+1.631
-53.24%
1 gen 2001 anni
-0.364
+1.069
-74.61%
1 gen 2002 anni
-1.707
-1.344
369.38%
1 gen 2003 anni
-0.906
+0.801
-46.94%
1 gen 2004 anni
-3.068
-2.162
238.66%
1 gen 2005 anni
-2.129
+0.939
-30.62%
1 gen 2006 anni
-4.221
-2.092
98.28%
1 gen 2007 anni
-2.289
+1.932
-45.77%
1 gen 2008 anni
-2.688
-0.399
17.44%
1 gen 2009 anni
-3.933
-1.245
46.31%
1 gen 2010 anni
-3.019
+0.915
-23.26%
Classificazione dei paesi secondo i statistiche attuali per anni
