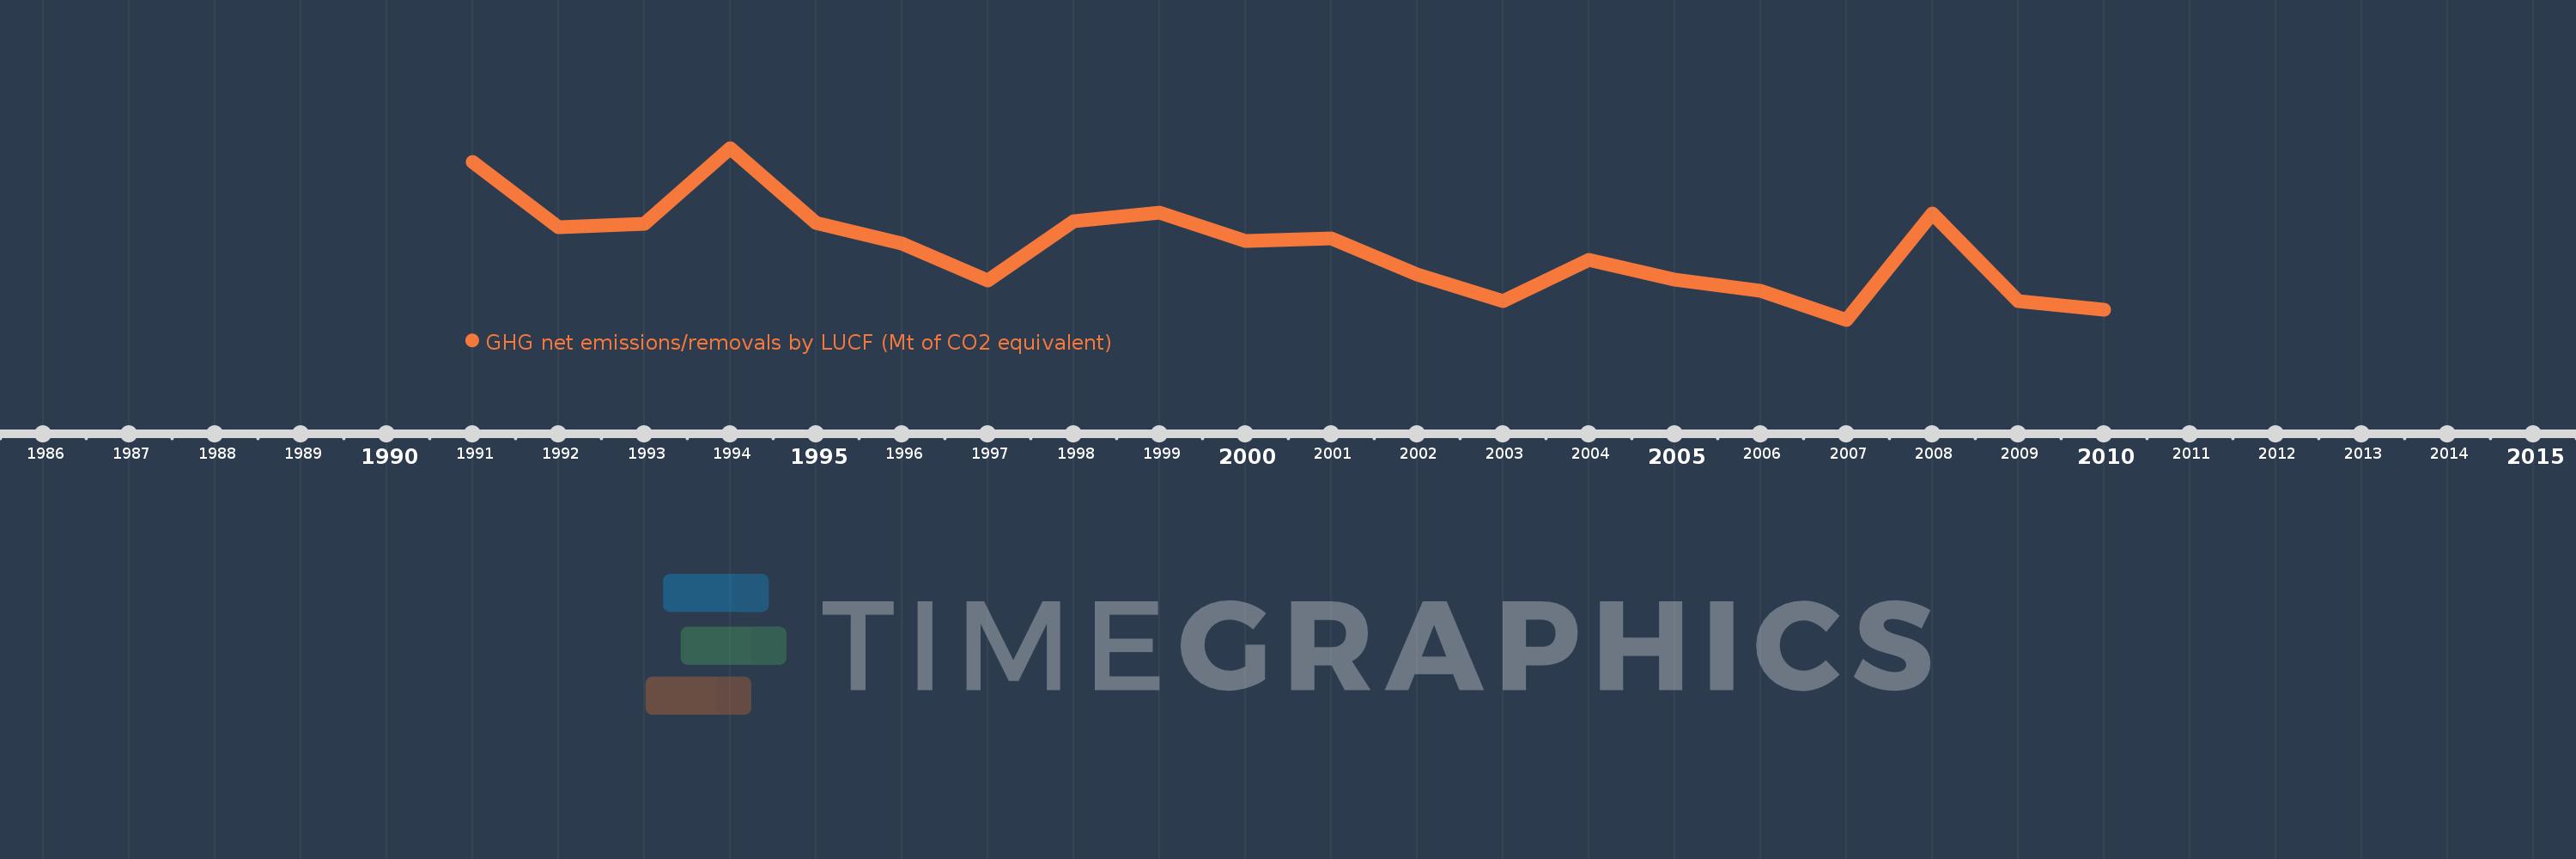
Questa scala temporale mostra un grafico dal 1991 anno al 2010 anno. Italy. I dati fino ad 1990 anno non disponibili. Il numero di osservazioni attuali secondo i date: 20.
La fonte (nome):
Indicatori dello sviluppo mondiale
La fonte (organizzazione):
United Nations Framework Convention on Climate Change.
Categorie:
Climate Change, Environment
sono stati aggiornati
23 apr 2017 anni
Indicatori delle variazioni dei valori per anni
In media:
-81.09
Minima:
-96.965
1 gen 2007 anni
Massimo:
-58.649
1 gen 1994 anni
Alla data di osservazione
Valore
Variazione assoluta
La variazione rispetto al valore precedente
1 gen 1991 anni
-61.795
-61.795
0.0%
1 gen 1992 anni
-76.256
-14.461
23.4%
1 gen 1993 anni
-75.485
+0.771
-1.01%
1 gen 1994 anni
-58.649
+16.836
-22.3%
1 gen 1995 anni
-75.425
-16.776
28.6%
1 gen 1996 anni
-79.924
-4.499
5.97%
1 gen 1997 anni
-88.165
-8.241
10.31%
1 gen 1998 anni
-75.075
+13.089
-14.85%
1 gen 1999 anni
-73.072
+2.004
-2.67%
1 gen 2000 anni
-79.423
-6.351
8.69%
1 gen 2001 anni
-78.891
+0.532
-0.67%
1 gen 2002 anni
-86.91
-8.019
10.16%
1 gen 2003 anni
-92.832
-5.922
6.81%
1 gen 2004 anni
-83.619
+9.213
-9.92%
1 gen 2005 anni
-87.971
-4.352
5.21%
1 gen 2006 anni
-90.542
-2.571
2.92%
1 gen 2007 anni
-96.965
-6.422
7.09%
1 gen 2008 anni
-73.31
+23.654
-24.39%
1 gen 2009 anni
-92.828
-19.518
26.62%
1 gen 2010 anni
-94.671
-1.843
1.99%
Classificazione dei paesi secondo i statistiche attuali per anni
