29
/it/
it
AIzaSyAYiBZKx7MnpbEhh9jyipgxe19OcubqV5w
April 1, 2024
170096
Korea, Rep.
KOR
true
2
1
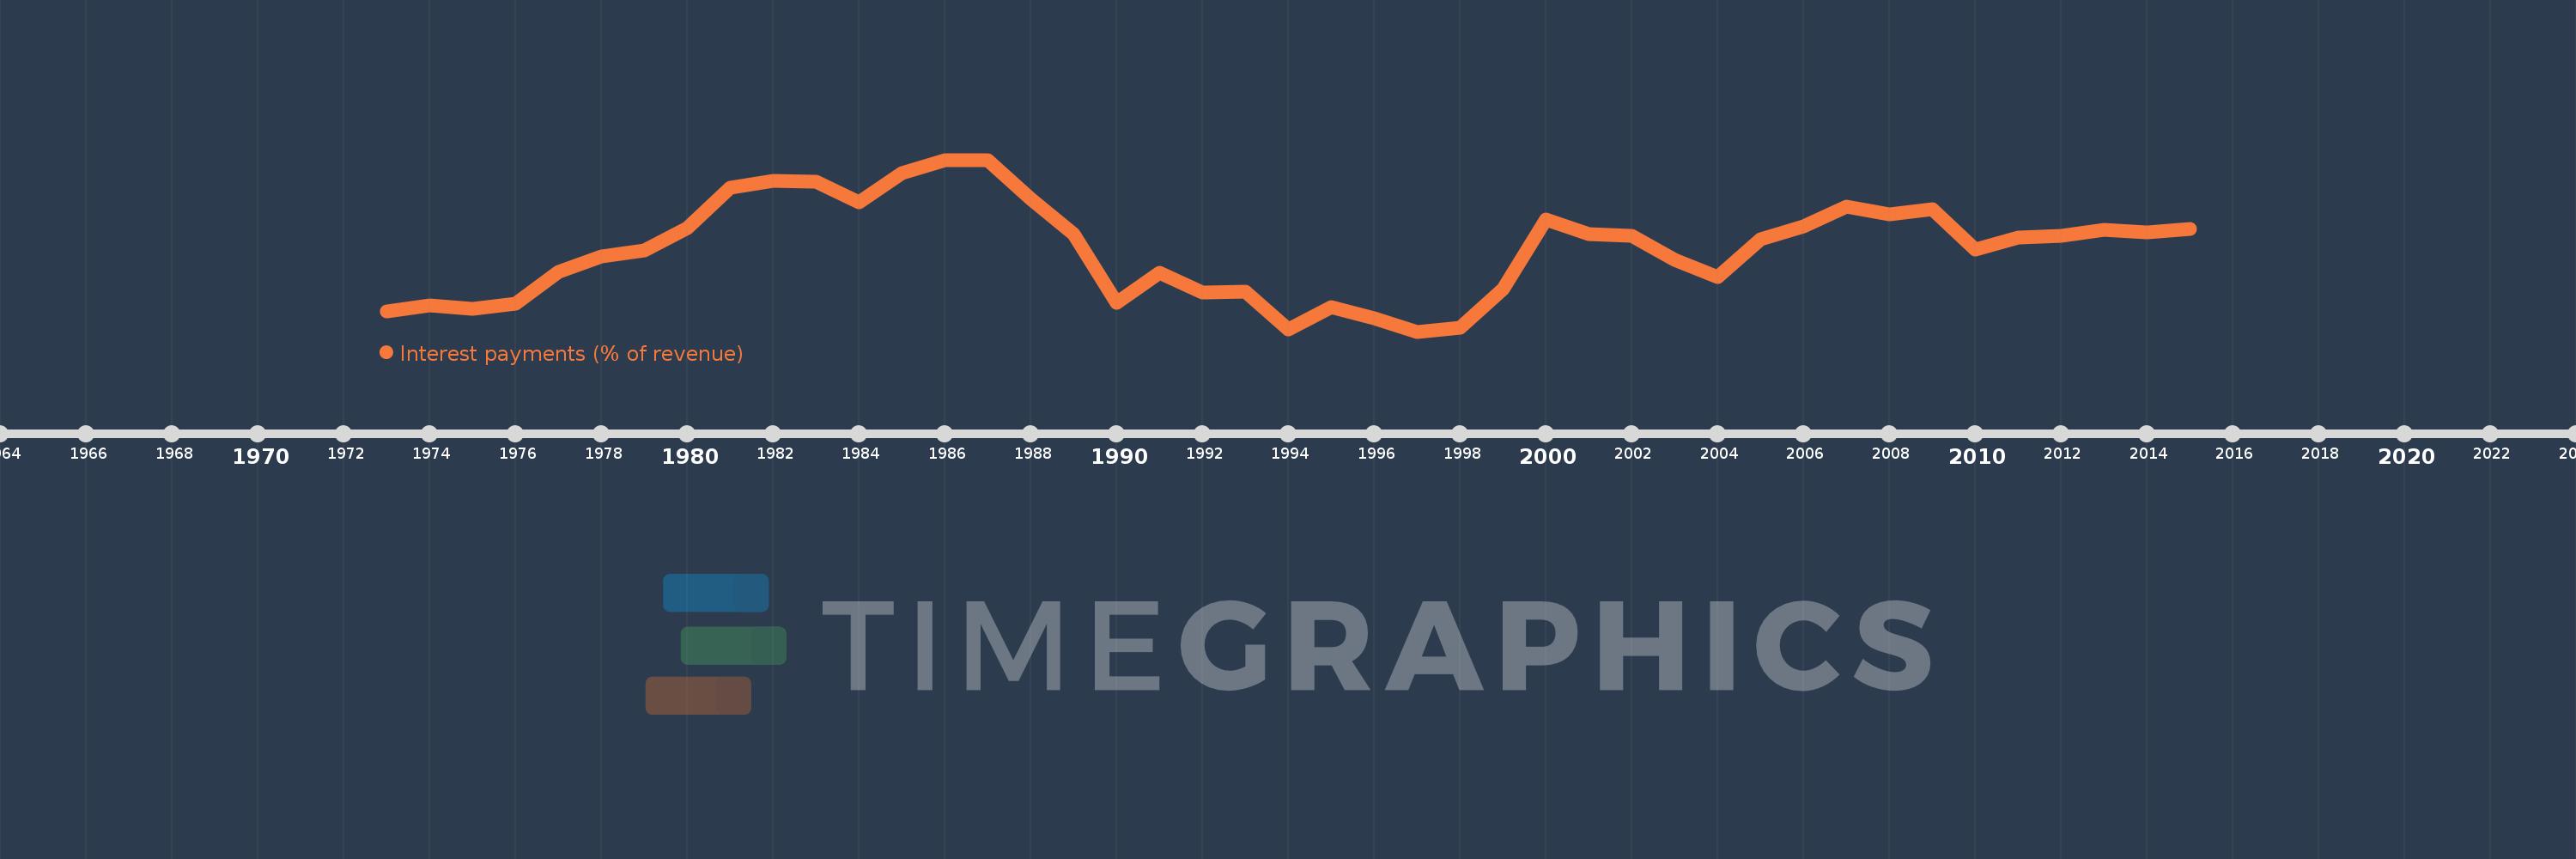
Interest payments (% of revenue)
2015,2014,2013,2012,2011,2010,2009,2008,2007,2006,2005,2004,2003,2002,2001,2000,1999,1998,1997,1996,1995,1994,1993,1992,1991,1990,1989,1988,1987,1986,1985,1984,1983,1982,1981,1980,1979,1978,1977,1976,1975,1974,1973
Queste statistiche in altri paesi:
AfghanistanAlbaniaAlgeriaAngolaAntigua and BarbudaArab WorldArmeniaAustraliaAustriaAzerbaijanBahamas, TheBahrainBangladeshBarbadosBelarusBelgiumBelizeBeninBhutanBoliviaBosnia and HerzegovinaBotswanaBrazilBulgariaBurkina FasoBurundiCabo VerdeCambodiaCanadaCaribbean small statesCentral African RepublicCentral Europe and the BalticsChileChinaColombiaCongo, Dem. Rep.Congo, Rep.Costa RicaCote d'IvoireCroatiaCyprusCzech RepublicDenmarkDominicaDominican RepublicEarly-demographic dividendEast Asia & PacificEast Asia & Pacific (excluding high income)East Asia & Pacific (IDA & IBRD countries)Egypt, Arab Rep.El SalvadorEquatorial GuineaEstoniaEthiopiaEuro areaEurope & Central AsiaEurope & Central Asia (excluding high income)Europe & Central Asia (IDA & IBRD countries)European UnionFijiFinlandFranceGambia, TheGeorgiaGermanyGhanaGreeceGrenadaGuatemalaHeavily indebted poor countries (HIPC)High incomeHondurasHong Kong SAR, ChinaHungaryIBRD onlyIcelandIDA & IBRD totalIDA blendIDA onlyIDA totalIndiaIndonesiaIran, Islamic Rep.IraqIrelandIsraelItalyJamaicaJapanJordanKazakhstanKenyaKiribatiKorea, Rep.KuwaitKyrgyz RepublicLao PDRLate-demographic dividendLatin America & Caribbean Latin America & Caribbean (excluding high income)Latin America & the Caribbean (IDA & IBRD countries)LatviaLeast developed countries: UN classificationLebanonLesothoLiberiaLithuaniaLow & middle incomeLow incomeLower middle incomeLuxembourgMacao SAR, ChinaMacedonia, FYRMadagascarMalawiMalaysiaMaldivesMaliMaltaMauritiusMexicoMicronesia, Fed. Sts.Middle East & North AfricaMiddle East & North Africa (excluding high income)Middle East & North Africa (IDA & IBRD countries)Middle incomeMoldovaMongoliaMoroccoMozambiqueNamibiaNepalNetherlandsNew ZealandNicaraguaNigeriaNorth AmericaNorwayOECD membersOmanOther small statesPakistanPanamaPapua New GuineaParaguayPeruPhilippinesPolandPortugalPost-demographic dividendPre-demographic dividendQatarRomaniaRussian FederationRwandaSamoaSan MarinoSao Tome and PrincipeSenegalSerbiaSeychellesSierra LeoneSingaporeSlovak RepublicSloveniaSmall statesSolomon IslandsSouth AfricaSouth AsiaSouth Asia (IDA & IBRD)SpainSri LankaSt. Kitts and NevisSt. LuciaSub-Saharan Africa Sub-Saharan Africa (excluding high income)Sub-Saharan Africa (IDA & IBRD countries)SurinameSwazilandSwedenSwitzerlandSyrian Arab RepublicTajikistanTanzaniaThailandTimor-LesteTogoTrinidad and TobagoTunisiaTurkeyUgandaUkraineUnited KingdomUnited StatesUpper middle incomeUruguayVanuatuVenezuela, RBVietnamWest Bank and GazaWorldYemen, Rep.ZambiaZimbabwe Linea del tempo:
Questa scala temporale mostra un grafico dal 1973 anno al 2015 anno. Korea, Rep.. I dati fino ad 1972 anno non disponibili. Il numero di osservazioni attuali secondo i date: 43.
La fonte (nome):
Indicatori dello sviluppo mondiale
La fonte (organizzazione):
International Monetary Fund, Government Finance Statistics Yearbook and data files.
Categorie:
Public Sector
sono stati aggiornati
23 apr 2017 anni
Indicatori delle variazioni dei valori per anni
Minima:
2.367
1 gen 1997 anni
Massimo:
7.228
1 gen 1986 anni
Alla data di osservazione
Valore
Variazione assoluta
La variazione rispetto al valore precedente
1 gen 1973 anni
2.946
+2.946
0.0%
1 gen 1974 anni
3.111
+0.165
5.59%
1 gen 1975 anni
3.021
-0.09
-2.88%
1 gen 1976 anni
3.157
+0.136
4.49%
1 gen 1977 anni
4.062
+0.905
28.66%
1 gen 1978 anni
4.493
+0.431
10.6%
1 gen 1979 anni
4.652
+0.159
3.55%
1 gen 1980 anni
5.301
+0.649
13.95%
1 gen 1981 anni
6.441
+1.14
21.5%
1 gen 1982 anni
6.644
+0.203
3.15%
1 gen 1983 anni
6.603
-0.041
-0.62%
1 gen 1984 anni
6.017
-0.586
-8.87%
1 gen 1985 anni
6.85
+0.833
13.85%
1 gen 1986 anni
7.228
+0.378
5.52%
1 gen 1987 anni
7.213
-0.015
-0.21%
1 gen 1988 anni
6.126
-1.087
-15.07%
1 gen 1989 anni
5.133
-0.993
-16.21%
1 gen 1990 anni
3.192
-1.942
-37.82%
1 gen 1991 anni
4.028
+0.836
26.19%
1 gen 1992 anni
3.463
-0.564
-14.01%
1 gen 1993 anni
3.487
+0.024
0.69%
1 gen 1994 anni
2.416
-1.071
-30.72%
1 gen 1995 anni
3.064
+0.648
26.82%
1 gen 1996 anni
2.742
-0.322
-10.51%
1 gen 1997 anni
2.367
-0.375
-13.67%
1 gen 1998 anni
2.488
+0.121
5.13%
1 gen 1999 anni
3.564
+1.076
43.24%
1 gen 2000 anni
5.55
+1.986
55.72%
1 gen 2001 anni
5.116
-0.435
-7.83%
1 gen 2002 anni
5.074
-0.042
-0.82%
1 gen 2003 anni
4.404
-0.67
-13.2%
1 gen 2004 anni
3.922
-0.482
-10.94%
1 gen 2005 anni
4.97
+1.048
26.72%
1 gen 2006 anni
5.354
+0.384
7.72%
1 gen 2007 anni
5.896
+0.542
10.12%
1 gen 2008 anni
5.696
-0.199
-3.38%
1 gen 2009 anni
5.821
+0.125
2.19%
1 gen 2010 anni
4.693
-1.129
-19.39%
1 gen 2011 anni
5.037
+0.344
7.34%
1 gen 2012 anni
5.068
+0.031
0.62%
1 gen 2013 anni
5.235
+0.167
3.29%
1 gen 2014 anni
5.172
-0.063
-1.21%
1 gen 2015 anni
5.263
+0.091
1.77%
Classificazione dei paesi secondo i statistiche attuali per anni


Commenti: