29
/it/
it
AIzaSyAYiBZKx7MnpbEhh9jyipgxe19OcubqV5w
April 1, 2024
160632
Israel
ISR
true
2
1
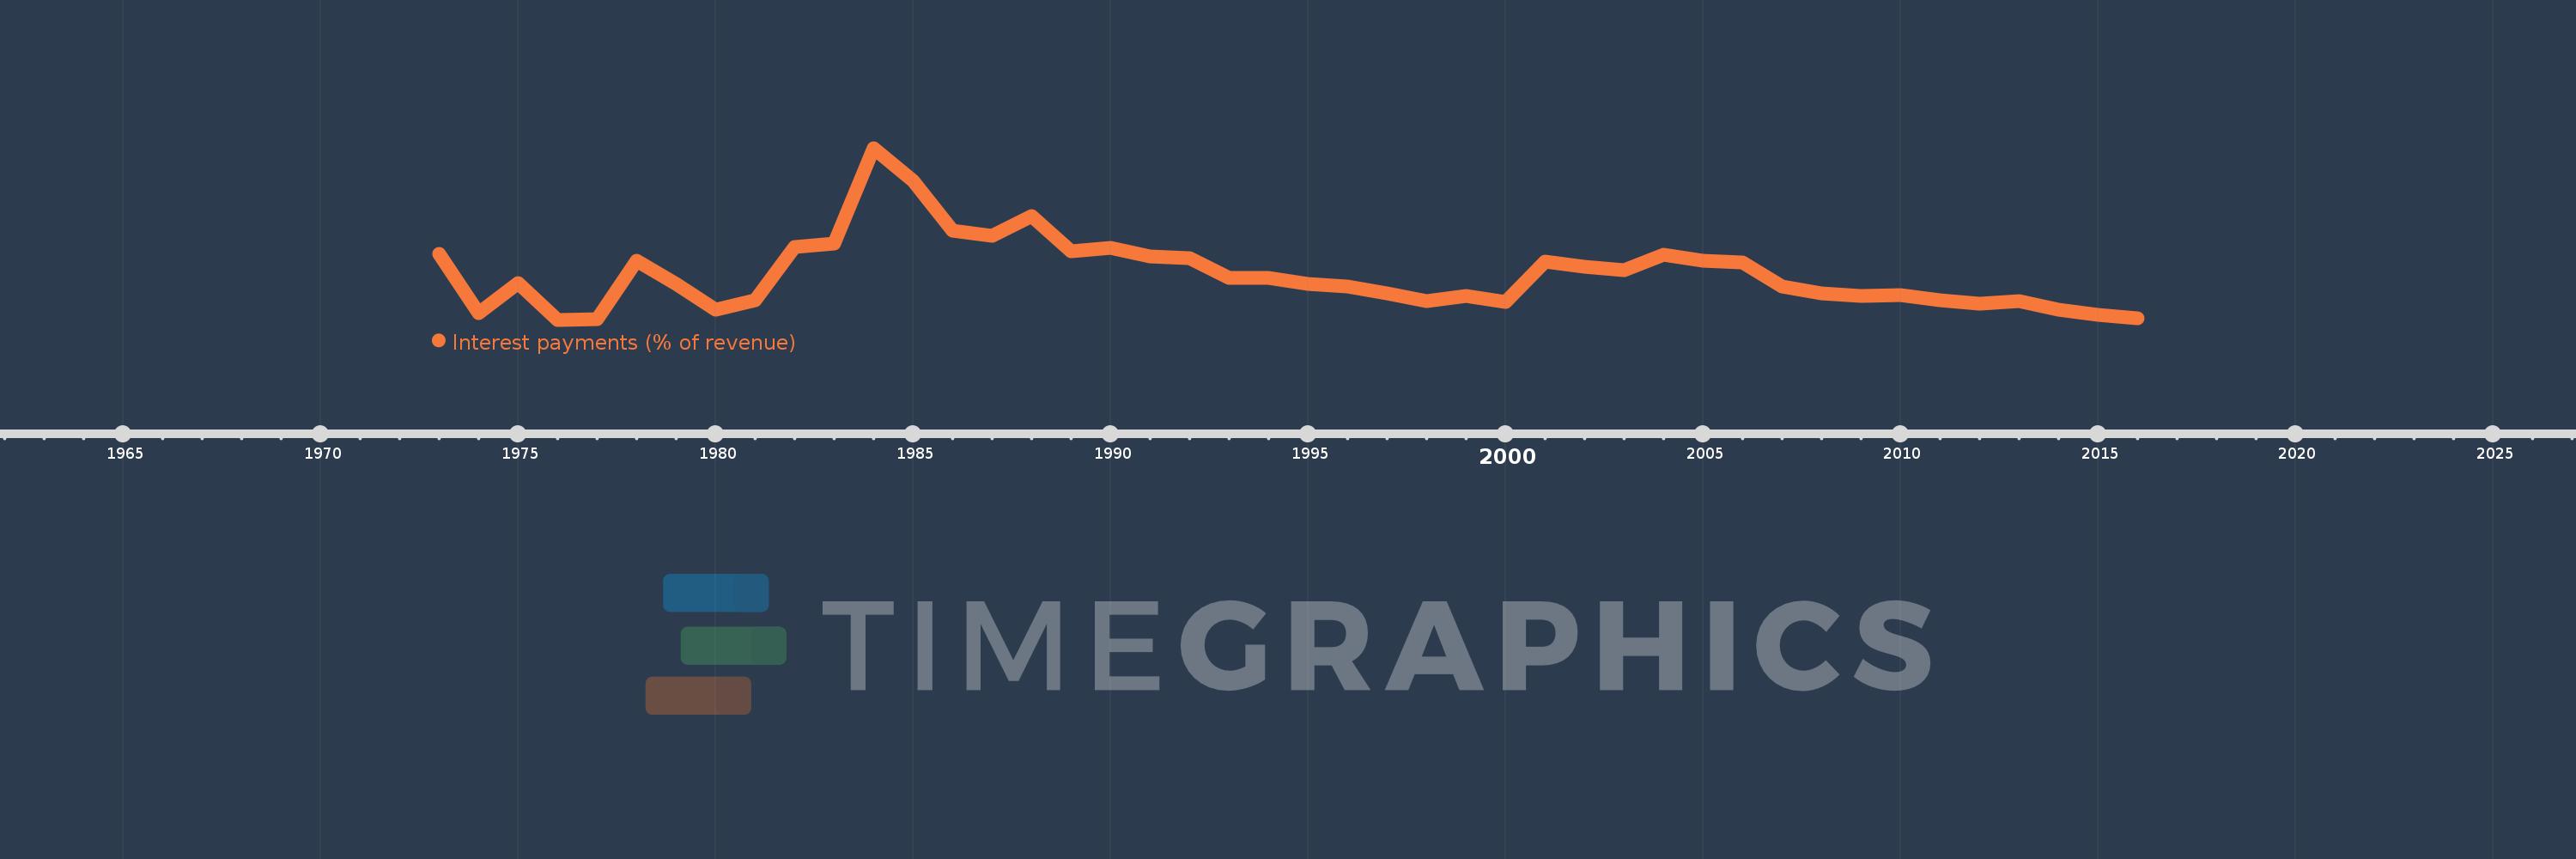
Interest payments (% of revenue)
2016,2015,2014,2013,2012,2011,2010,2009,2008,2007,2006,2005,2004,2003,2002,2001,2000,1999,1998,1997,1996,1995,1994,1993,1992,1991,1990,1989,1988,1987,1986,1985,1984,1983,1982,1981,1980,1979,1978,1977,1976,1975,1974,1973
Queste statistiche in altri paesi:
AfghanistanAlbaniaAlgeriaAngolaAntigua and BarbudaArab WorldArmeniaAustraliaAustriaAzerbaijanBahamas, TheBahrainBangladeshBarbadosBelarusBelgiumBelizeBeninBhutanBoliviaBosnia and HerzegovinaBotswanaBrazilBulgariaBurkina FasoBurundiCabo VerdeCambodiaCanadaCaribbean small statesCentral African RepublicCentral Europe and the BalticsChileChinaColombiaCongo, Dem. Rep.Congo, Rep.Costa RicaCote d'IvoireCroatiaCyprusCzech RepublicDenmarkDominicaDominican RepublicEarly-demographic dividendEast Asia & PacificEast Asia & Pacific (excluding high income)East Asia & Pacific (IDA & IBRD countries)Egypt, Arab Rep.El SalvadorEquatorial GuineaEstoniaEthiopiaEuro areaEurope & Central AsiaEurope & Central Asia (excluding high income)Europe & Central Asia (IDA & IBRD countries)European UnionFijiFinlandFranceGambia, TheGeorgiaGermanyGhanaGreeceGrenadaGuatemalaHeavily indebted poor countries (HIPC)High incomeHondurasHong Kong SAR, ChinaHungaryIBRD onlyIcelandIDA & IBRD totalIDA blendIDA onlyIDA totalIndiaIndonesiaIran, Islamic Rep.IraqIrelandIsraelItalyJamaicaJapanJordanKazakhstanKenyaKiribatiKorea, Rep.KuwaitKyrgyz RepublicLao PDRLate-demographic dividendLatin America & Caribbean Latin America & Caribbean (excluding high income)Latin America & the Caribbean (IDA & IBRD countries)LatviaLeast developed countries: UN classificationLebanonLesothoLiberiaLithuaniaLow & middle incomeLow incomeLower middle incomeLuxembourgMacao SAR, ChinaMacedonia, FYRMadagascarMalawiMalaysiaMaldivesMaliMaltaMauritiusMexicoMicronesia, Fed. Sts.Middle East & North AfricaMiddle East & North Africa (excluding high income)Middle East & North Africa (IDA & IBRD countries)Middle incomeMoldovaMongoliaMoroccoMozambiqueNamibiaNepalNetherlandsNew ZealandNicaraguaNigeriaNorth AmericaNorwayOECD membersOmanOther small statesPakistanPanamaPapua New GuineaParaguayPeruPhilippinesPolandPortugalPost-demographic dividendPre-demographic dividendQatarRomaniaRussian FederationRwandaSamoaSan MarinoSao Tome and PrincipeSenegalSerbiaSeychellesSierra LeoneSingaporeSlovak RepublicSloveniaSmall statesSolomon IslandsSouth AfricaSouth AsiaSouth Asia (IDA & IBRD)SpainSri LankaSt. Kitts and NevisSt. LuciaSub-Saharan Africa Sub-Saharan Africa (excluding high income)Sub-Saharan Africa (IDA & IBRD countries)SurinameSwazilandSwedenSwitzerlandSyrian Arab RepublicTajikistanTanzaniaThailandTimor-LesteTogoTrinidad and TobagoTunisiaTurkeyUgandaUkraineUnited KingdomUnited StatesUpper middle incomeUruguayVanuatuVenezuela, RBVietnamWest Bank and GazaWorldYemen, Rep.ZambiaZimbabwe Linea del tempo:
Questa scala temporale mostra un grafico dal 1973 anno al 2016 anno. Israel. I dati fino ad 1972 anno non disponibili. Il numero di osservazioni attuali secondo i date: 44.
La fonte (nome):
Indicatori dello sviluppo mondiale
La fonte (organizzazione):
International Monetary Fund, Government Finance Statistics Yearbook and data files.
Categorie:
Public Sector
sono stati aggiornati
23 apr 2017 anni
Indicatori delle variazioni dei valori per anni
Minima:
9.524
1 gen 1976 anni
Massimo:
36.84
1 gen 1984 anni
Alla data di osservazione
Valore
Variazione assoluta
La variazione rispetto al valore precedente
1 gen 1973 anni
20.0
+20.0
0.0%
1 gen 1974 anni
10.526
-9.474
-47.37%
1 gen 1975 anni
15.385
+4.858
46.15%
1 gen 1976 anni
9.524
-5.861
-38.1%
1 gen 1977 anni
9.677
+0.154
1.61%
1 gen 1978 anni
18.889
+9.211
95.19%
1 gen 1979 anni
15.278
-3.611
-19.12%
1 gen 1980 anni
11.148
-4.13
-27.03%
1 gen 1981 anni
12.626
+1.478
13.26%
1 gen 1982 anni
21.139
+8.514
67.43%
1 gen 1983 anni
21.683
+0.544
2.57%
1 gen 1984 anni
36.84
+15.157
69.9%
1 gen 1985 anni
31.676
-5.164
-14.02%
1 gen 1986 anni
23.642
-8.034
-25.36%
1 gen 1987 anni
22.917
-0.725
-3.07%
1 gen 1988 anni
25.971
+3.054
13.33%
1 gen 1989 anni
20.469
-5.502
-21.18%
1 gen 1990 anni
20.967
+0.497
2.43%
1 gen 1991 anni
19.543
-1.424
-6.79%
1 gen 1992 anni
19.316
-0.227
-1.16%
1 gen 1993 anni
16.152
-3.164
-16.38%
1 gen 1994 anni
16.115
-0.037
-0.23%
1 gen 1995 anni
15.181
-0.934
-5.79%
1 gen 1996 anni
14.831
-0.351
-2.31%
1 gen 1997 anni
13.713
-1.117
-7.53%
1 gen 1998 anni
12.505
-1.209
-8.81%
1 gen 1999 anni
13.25
+0.745
5.96%
1 gen 2000 anni
12.374
-0.876
-6.61%
1 gen 2001 anni
18.829
+6.455
52.16%
1 gen 2002 anni
18.007
-0.822
-4.37%
1 gen 2003 anni
17.447
-0.56
-3.11%
1 gen 2004 anni
19.833
+2.386
13.68%
1 gen 2005 anni
18.854
-0.979
-4.94%
1 gen 2006 anni
18.578
-0.276
-1.47%
1 gen 2007 anni
14.869
-3.708
-19.96%
1 gen 2008 anni
13.706
-1.164
-7.82%
1 gen 2009 anni
13.312
-0.394
-2.87%
1 gen 2010 anni
13.451
+0.139
1.05%
1 gen 2011 anni
12.585
-0.867
-6.44%
1 gen 2012 anni
12.098
-0.487
-3.87%
1 gen 2013 anni
12.54
+0.443
3.66%
1 gen 2014 anni
11.081
-1.459
-11.63%
1 gen 2015 anni
10.344
-0.738
-6.66%
1 gen 2016 anni
9.748
-0.595
-5.76%
Classificazione dei paesi secondo i statistiche attuali per anni


Commenti: