29
/it/
it
AIzaSyAYiBZKx7MnpbEhh9jyipgxe19OcubqV5w
April 1, 2024
134260
France
FRA
true
2
1
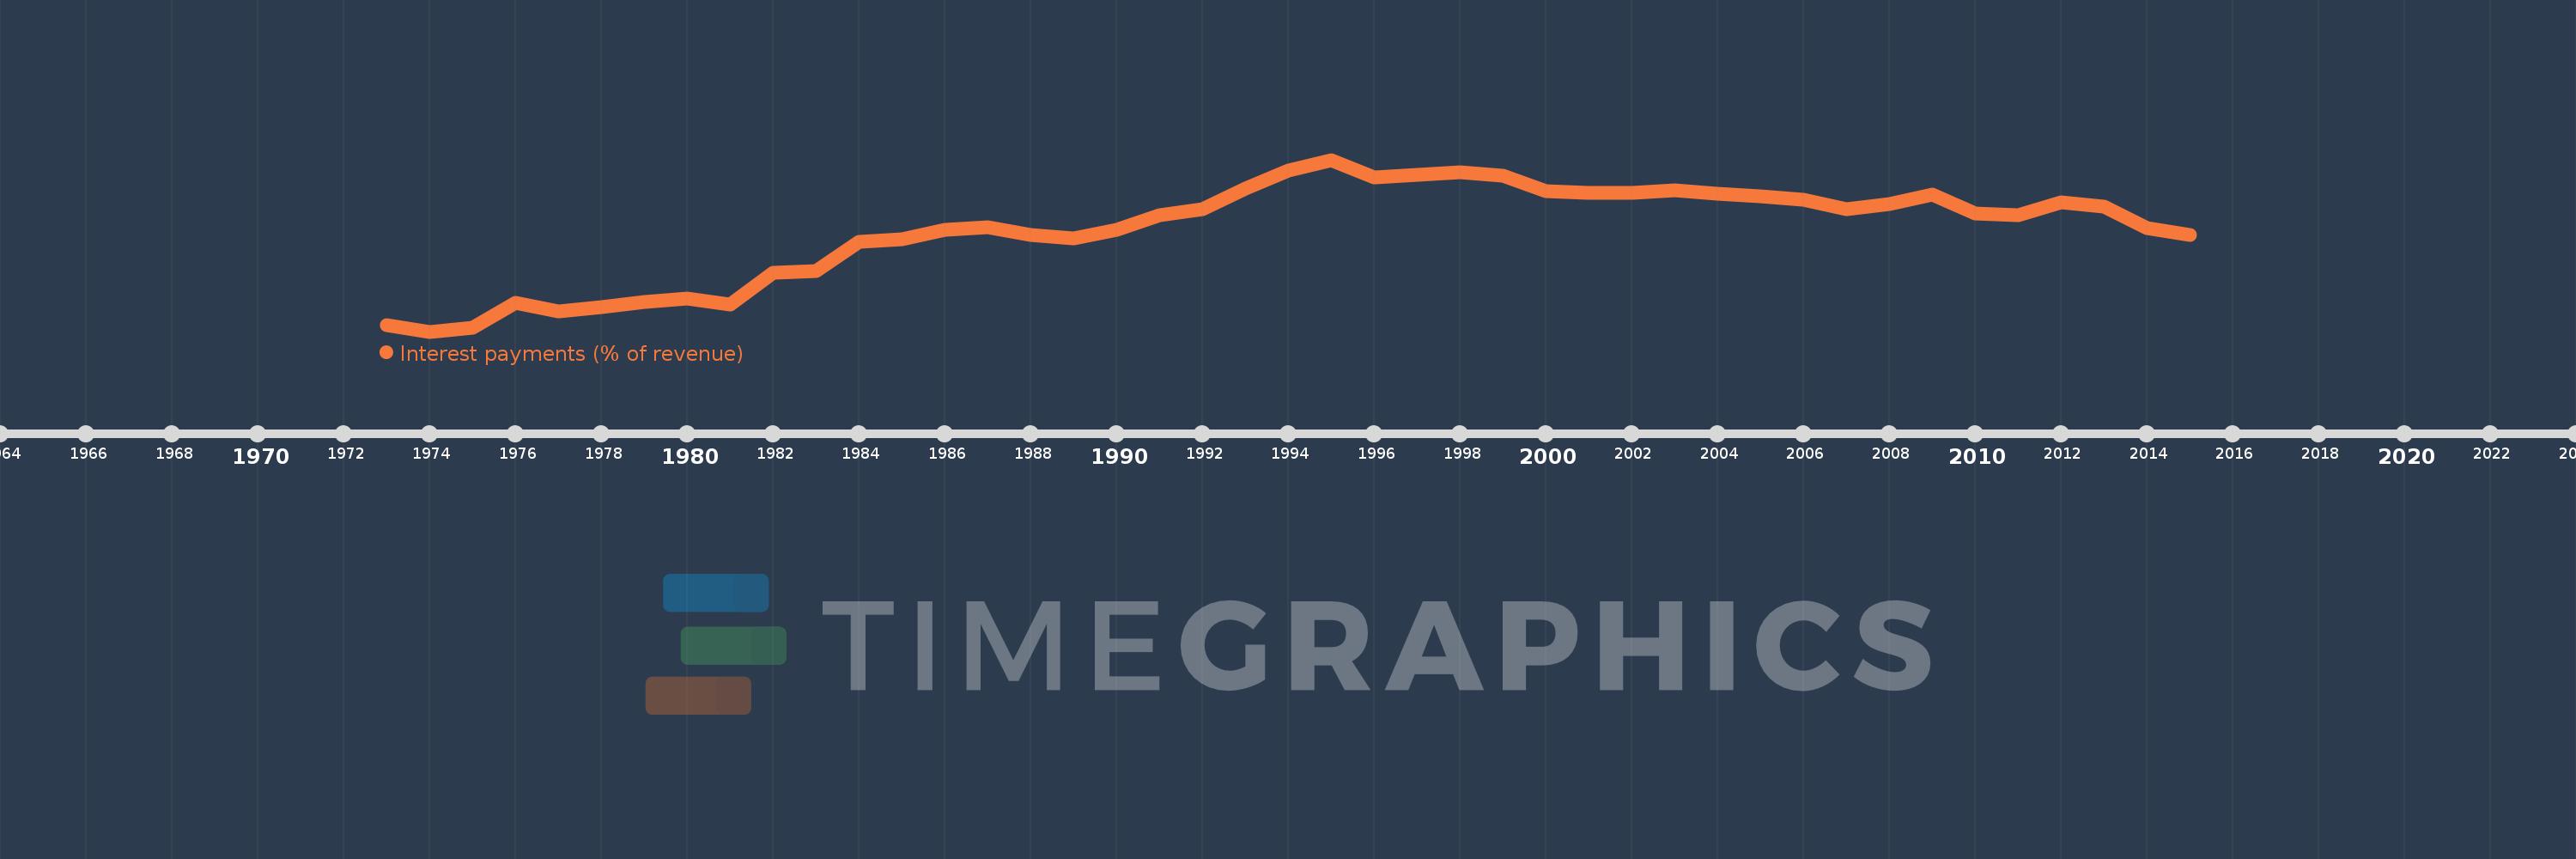
Interest payments (% of revenue)
2015,2014,2013,2012,2011,2010,2009,2008,2007,2006,2005,2004,2003,2002,2001,2000,1999,1998,1997,1996,1995,1994,1993,1992,1991,1990,1989,1988,1987,1986,1985,1984,1983,1982,1981,1980,1979,1978,1977,1976,1975,1974,1973
Queste statistiche in altri paesi:
AfghanistanAlbaniaAlgeriaAngolaAntigua and BarbudaArab WorldArmeniaAustraliaAustriaAzerbaijanBahamas, TheBahrainBangladeshBarbadosBelarusBelgiumBelizeBeninBhutanBoliviaBosnia and HerzegovinaBotswanaBrazilBulgariaBurkina FasoBurundiCabo VerdeCambodiaCanadaCaribbean small statesCentral African RepublicCentral Europe and the BalticsChileChinaColombiaCongo, Dem. Rep.Congo, Rep.Costa RicaCote d'IvoireCroatiaCyprusCzech RepublicDenmarkDominicaDominican RepublicEarly-demographic dividendEast Asia & PacificEast Asia & Pacific (excluding high income)East Asia & Pacific (IDA & IBRD countries)Egypt, Arab Rep.El SalvadorEquatorial GuineaEstoniaEthiopiaEuro areaEurope & Central AsiaEurope & Central Asia (excluding high income)Europe & Central Asia (IDA & IBRD countries)European UnionFijiFinlandFranceGambia, TheGeorgiaGermanyGhanaGreeceGrenadaGuatemalaHeavily indebted poor countries (HIPC)High incomeHondurasHong Kong SAR, ChinaHungaryIBRD onlyIcelandIDA & IBRD totalIDA blendIDA onlyIDA totalIndiaIndonesiaIran, Islamic Rep.IraqIrelandIsraelItalyJamaicaJapanJordanKazakhstanKenyaKiribatiKorea, Rep.KuwaitKyrgyz RepublicLao PDRLate-demographic dividendLatin America & Caribbean Latin America & Caribbean (excluding high income)Latin America & the Caribbean (IDA & IBRD countries)LatviaLeast developed countries: UN classificationLebanonLesothoLiberiaLithuaniaLow & middle incomeLow incomeLower middle incomeLuxembourgMacao SAR, ChinaMacedonia, FYRMadagascarMalawiMalaysiaMaldivesMaliMaltaMauritiusMexicoMicronesia, Fed. Sts.Middle East & North AfricaMiddle East & North Africa (excluding high income)Middle East & North Africa (IDA & IBRD countries)Middle incomeMoldovaMongoliaMoroccoMozambiqueNamibiaNepalNetherlandsNew ZealandNicaraguaNigeriaNorth AmericaNorwayOECD membersOmanOther small statesPakistanPanamaPapua New GuineaParaguayPeruPhilippinesPolandPortugalPost-demographic dividendPre-demographic dividendQatarRomaniaRussian FederationRwandaSamoaSan MarinoSao Tome and PrincipeSenegalSerbiaSeychellesSierra LeoneSingaporeSlovak RepublicSloveniaSmall statesSolomon IslandsSouth AfricaSouth AsiaSouth Asia (IDA & IBRD)SpainSri LankaSt. Kitts and NevisSt. LuciaSub-Saharan Africa Sub-Saharan Africa (excluding high income)Sub-Saharan Africa (IDA & IBRD countries)SurinameSwazilandSwedenSwitzerlandSyrian Arab RepublicTajikistanTanzaniaThailandTimor-LesteTogoTrinidad and TobagoTunisiaTurkeyUgandaUkraineUnited KingdomUnited StatesUpper middle incomeUruguayVanuatuVenezuela, RBVietnamWest Bank and GazaWorldYemen, Rep.ZambiaZimbabwe Linea del tempo:
Questa scala temporale mostra un grafico dal 1973 anno al 2015 anno. France. I dati fino ad 1972 anno non disponibili. Il numero di osservazioni attuali secondo i date: 43.
La fonte (nome):
Indicatori dello sviluppo mondiale
La fonte (organizzazione):
International Monetary Fund, Government Finance Statistics Yearbook and data files.
Categorie:
Public Sector
sono stati aggiornati
23 apr 2017 anni
Indicatori delle variazioni dei valori per anni
Minima:
1.153
1 gen 1974 anni
Massimo:
7.156
1 gen 1995 anni
Alla data di osservazione
Valore
Variazione assoluta
La variazione rispetto al valore precedente
1 gen 1973 anni
1.378
+1.378
0.0%
1 gen 1974 anni
1.153
-0.225
-16.32%
1 gen 1975 anni
1.29
+0.136
11.84%
1 gen 1976 anni
2.169
+0.879
68.18%
1 gen 1977 anni
1.848
-0.321
-14.81%
1 gen 1978 anni
2.017
+0.169
9.17%
1 gen 1979 anni
2.194
+0.176
8.75%
1 gen 1980 anni
2.303
+0.11
5.0%
1 gen 1981 anni
2.09
-0.213
-9.25%
1 gen 1982 anni
3.207
+1.117
53.44%
1 gen 1983 anni
3.262
+0.055
1.71%
1 gen 1984 anni
4.287
+1.025
31.41%
1 gen 1985 anni
4.386
+0.1
2.33%
1 gen 1986 anni
4.719
+0.332
7.57%
1 gen 1987 anni
4.798
+0.079
1.68%
1 gen 1988 anni
4.52
-0.278
-5.8%
1 gen 1989 anni
4.409
-0.111
-2.45%
1 gen 1990 anni
4.697
+0.288
6.54%
1 gen 1991 anni
5.218
+0.521
11.1%
1 gen 1992 anni
5.422
+0.204
3.91%
1 gen 1993 anni
6.143
+0.721
13.29%
1 gen 1994 anni
6.794
+0.651
10.6%
1 gen 1995 anni
7.156
+0.362
5.33%
1 gen 1996 anni
6.544
-0.612
-8.56%
1 gen 1997 anni
6.643
+0.099
1.51%
1 gen 1998 anni
6.713
+0.071
1.06%
1 gen 1999 anni
6.606
-0.107
-1.6%
1 gen 2000 anni
6.046
-0.559
-8.47%
1 gen 2001 anni
5.991
-0.055
-0.92%
1 gen 2002 anni
5.989
-0.002
-0.04%
1 gen 2003 anni
6.103
+0.115
1.92%
1 gen 2004 anni
5.972
-0.131
-2.15%
1 gen 2005 anni
5.887
-0.085
-1.42%
1 gen 2006 anni
5.757
-0.13
-2.21%
1 gen 2007 anni
5.431
-0.327
-5.67%
1 gen 2008 anni
5.615
+0.184
3.39%
1 gen 2009 anni
5.935
+0.321
5.71%
1 gen 2010 anni
5.28
-0.655
-11.04%
1 gen 2011 anni
5.212
-0.068
-1.3%
1 gen 2012 anni
5.684
+0.472
9.07%
1 gen 2013 anni
5.51
-0.174
-3.06%
1 gen 2014 anni
4.763
-0.747
-13.56%
1 gen 2015 anni
4.541
-0.222
-4.67%
Classificazione dei paesi secondo i statistiche attuali per anni


Commenti: