29
/it/
it
AIzaSyAYiBZKx7MnpbEhh9jyipgxe19OcubqV5w
April 1, 2024
114059
Cote d'Ivoire
CIV
true
2
1
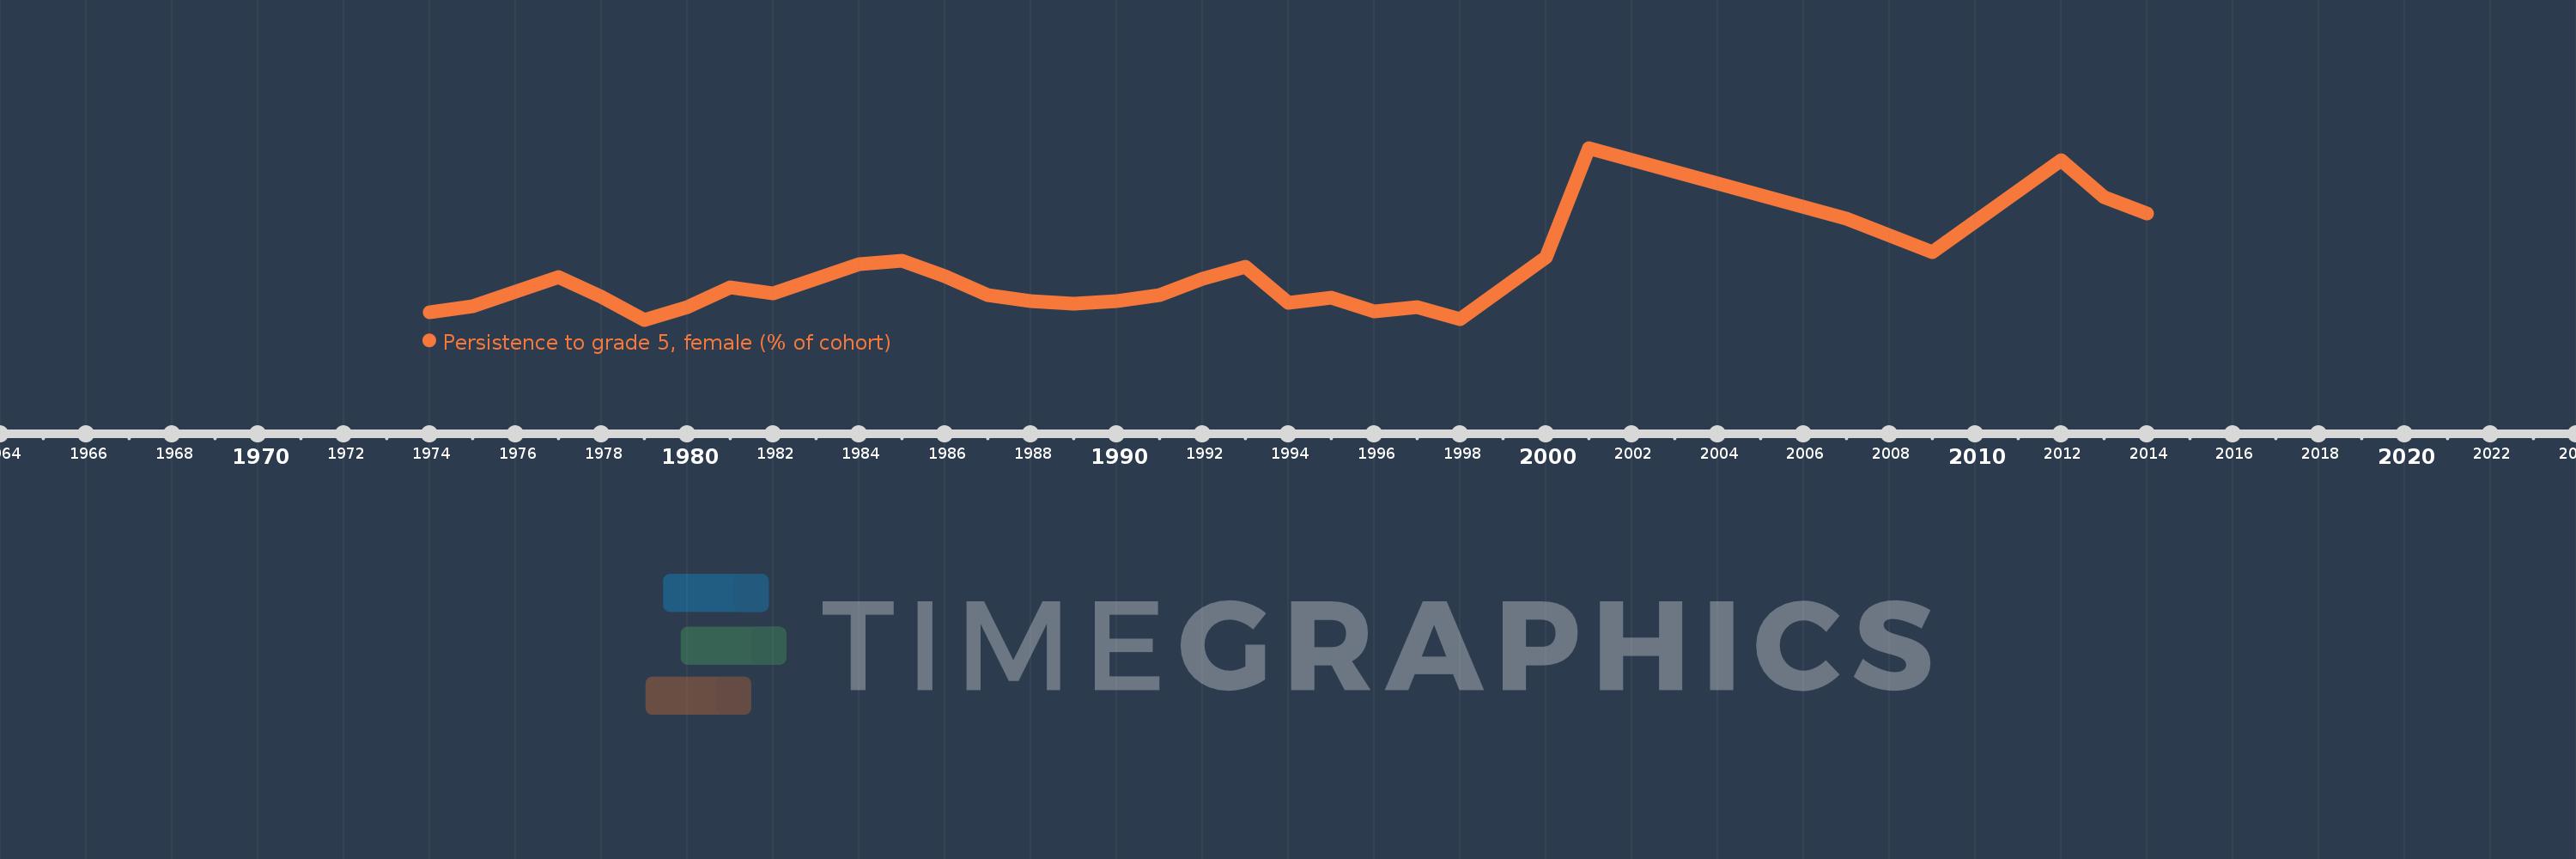
Persistence to grade 5, female (% of cohort)
2014,2013,2012,2009,2007,2001,2000,1998,1997,1996,1995,1994,1993,1992,1991,1990,1989,1988,1987,1986,1985,1984,1982,1981,1980,1979,1978,1977,1975,1974
Queste statistiche in altri paesi:
AfghanistanAlbaniaAlgeriaAndorraAngolaAntigua and BarbudaArab WorldArgentinaArubaBahamas, TheBahrainBangladeshBarbadosBelgiumBelizeBeninBermudaBhutanBoliviaBosnia and HerzegovinaBotswanaBrunei DarussalamBurkina FasoBurundiCabo VerdeCambodiaCameroonCanadaCaribbean small statesCayman IslandsCentral African RepublicChadChileChinaColombiaComorosCongo, Dem. Rep.Congo, Rep.Costa RicaCote d'IvoireCubaCyprusCzech RepublicDenmarkDjiboutiDominicaDominican RepublicEarly-demographic dividendEast Asia & PacificEast Asia & Pacific (excluding high income)East Asia & Pacific (IDA & IBRD countries)EcuadorEgypt, Arab Rep.El SalvadorEquatorial GuineaEritreaEstoniaEthiopiaFijiFinlandFranceGabonGambia, TheGeorgiaGhanaGreeceGrenadaGuatemalaGuineaGuinea-BissauGuyanaHaitiHeavily indebted poor countries (HIPC)HondurasHong Kong SAR, ChinaHungaryIcelandIDA blendIDA onlyIDA totalIndiaIndonesiaIran, Islamic Rep.IraqIrelandIsraelItalyJamaicaJapanJordanKenyaKiribatiKorea, Rep.KuwaitLao PDRLate-demographic dividendLatviaLeast developed countries: UN classificationLebanonLesothoLiberiaLibyaLiechtensteinLow incomeLower middle incomeLuxembourgMacao SAR, ChinaMadagascarMalawiMalaysiaMaldivesMaliMaltaMarshall IslandsMauritaniaMauritiusMexicoMiddle East & North AfricaMiddle East & North Africa (excluding high income)Middle East & North Africa (IDA & IBRD countries)MontenegroMoroccoMozambiqueMyanmarNamibiaNepalNetherlandsNicaraguaNigerNigeriaNorwayOmanOther small statesPacific island small statesPakistanPanamaPapua New GuineaParaguayPeruPhilippinesPolandPortugalPre-demographic dividendQatarRwandaSamoaSan MarinoSao Tome and PrincipeSaudi ArabiaSenegalSeychellesSierra LeoneSingaporeSloveniaSolomon IslandsSouth AfricaSouth AsiaSouth Asia (IDA & IBRD)SpainSri LankaSt. Kitts and NevisSt. LuciaSt. Vincent and the GrenadinesSub-Saharan Africa Sub-Saharan Africa (excluding high income)Sub-Saharan Africa (IDA & IBRD countries)SudanSurinameSwazilandSwedenSwitzerlandSyrian Arab RepublicTanzaniaThailandTimor-LesteTogoTongaTrinidad and TobagoTunisiaTurkeyUgandaUnited Arab EmiratesUpper middle incomeUruguayVanuatuVenezuela, RBVietnamYemen, Rep.ZambiaZimbabwe Linea del tempo:
Questa scala temporale mostra un grafico dal 1974 anno al 2014 anno. Cote d'Ivoire. I dati fino ad 1973 anno non disponibili. Il numero di osservazioni attuali secondo i date: 30.
La fonte (nome):
Indicatori dello sviluppo mondiale
La fonte (organizzazione):
United Nations Educational, Scientific, and Cultural Organization (UNESCO) Institute for Statistics.
Categorie:
Education, Gender
sono stati aggiornati
23 apr 2017 anni
Indicatori delle variazioni dei valori per anni
Minima:
52.016
1 gen 1979 anni
Massimo:
87.855
1 gen 2001 anni
Alla data di osservazione
Valore
Variazione assoluta
La variazione rispetto al valore precedente
1 gen 1974 anni
53.593
+53.593
0.0%
1 gen 1975 anni
54.748
+1.155
2.16%
1 gen 1977 anni
60.999
+6.251
11.42%
1 gen 1978 anni
56.738
-4.261
-6.99%
1 gen 1979 anni
52.016
-4.722
-8.32%
1 gen 1980 anni
54.67
+2.654
5.1%
1 gen 1981 anni
58.707
+4.038
7.39%
1 gen 1982 anni
57.519
-1.189
-2.02%
1 gen 1984 anni
63.646
+6.127
10.65%
1 gen 1985 anni
64.404
+0.759
1.19%
1 gen 1986 anni
61.108
-3.296
-5.12%
1 gen 1987 anni
57.07
-4.039
-6.61%
1 gen 1988 anni
55.968
-1.102
-1.93%
1 gen 1989 anni
55.432
-0.536
-0.96%
1 gen 1990 anni
55.872
+0.44
0.79%
1 gen 1991 anni
57.141
+1.269
2.27%
1 gen 1992 anni
60.567
+3.427
6.0%
1 gen 1993 anni
63.079
+2.511
4.15%
1 gen 1994 anni
55.525
-7.553
-11.97%
1 gen 1995 anni
56.534
+1.009
1.82%
1 gen 1996 anni
53.747
-2.787
-4.93%
1 gen 1997 anni
54.696
+0.949
1.77%
1 gen 1998 anni
52.069
-2.627
-4.8%
1 gen 2000 anni
64.968
+12.899
24.77%
1 gen 2001 anni
87.855
+22.887
35.23%
1 gen 2007 anni
73.118
-14.737
-16.77%
1 gen 2009 anni
66.04
-7.078
-9.68%
1 gen 2012 anni
85.331
+19.291
29.21%
1 gen 2013 anni
77.632
-7.7
-9.02%
1 gen 2014 anni
74.119
-3.513
-4.52%
Classificazione dei paesi secondo i statistiche attuali per anni


Commenti: