29
/it/
it
AIzaSyAYiBZKx7MnpbEhh9jyipgxe19OcubqV5w
April 1, 2024
203386
Mozambique
MOZ
true
2
1
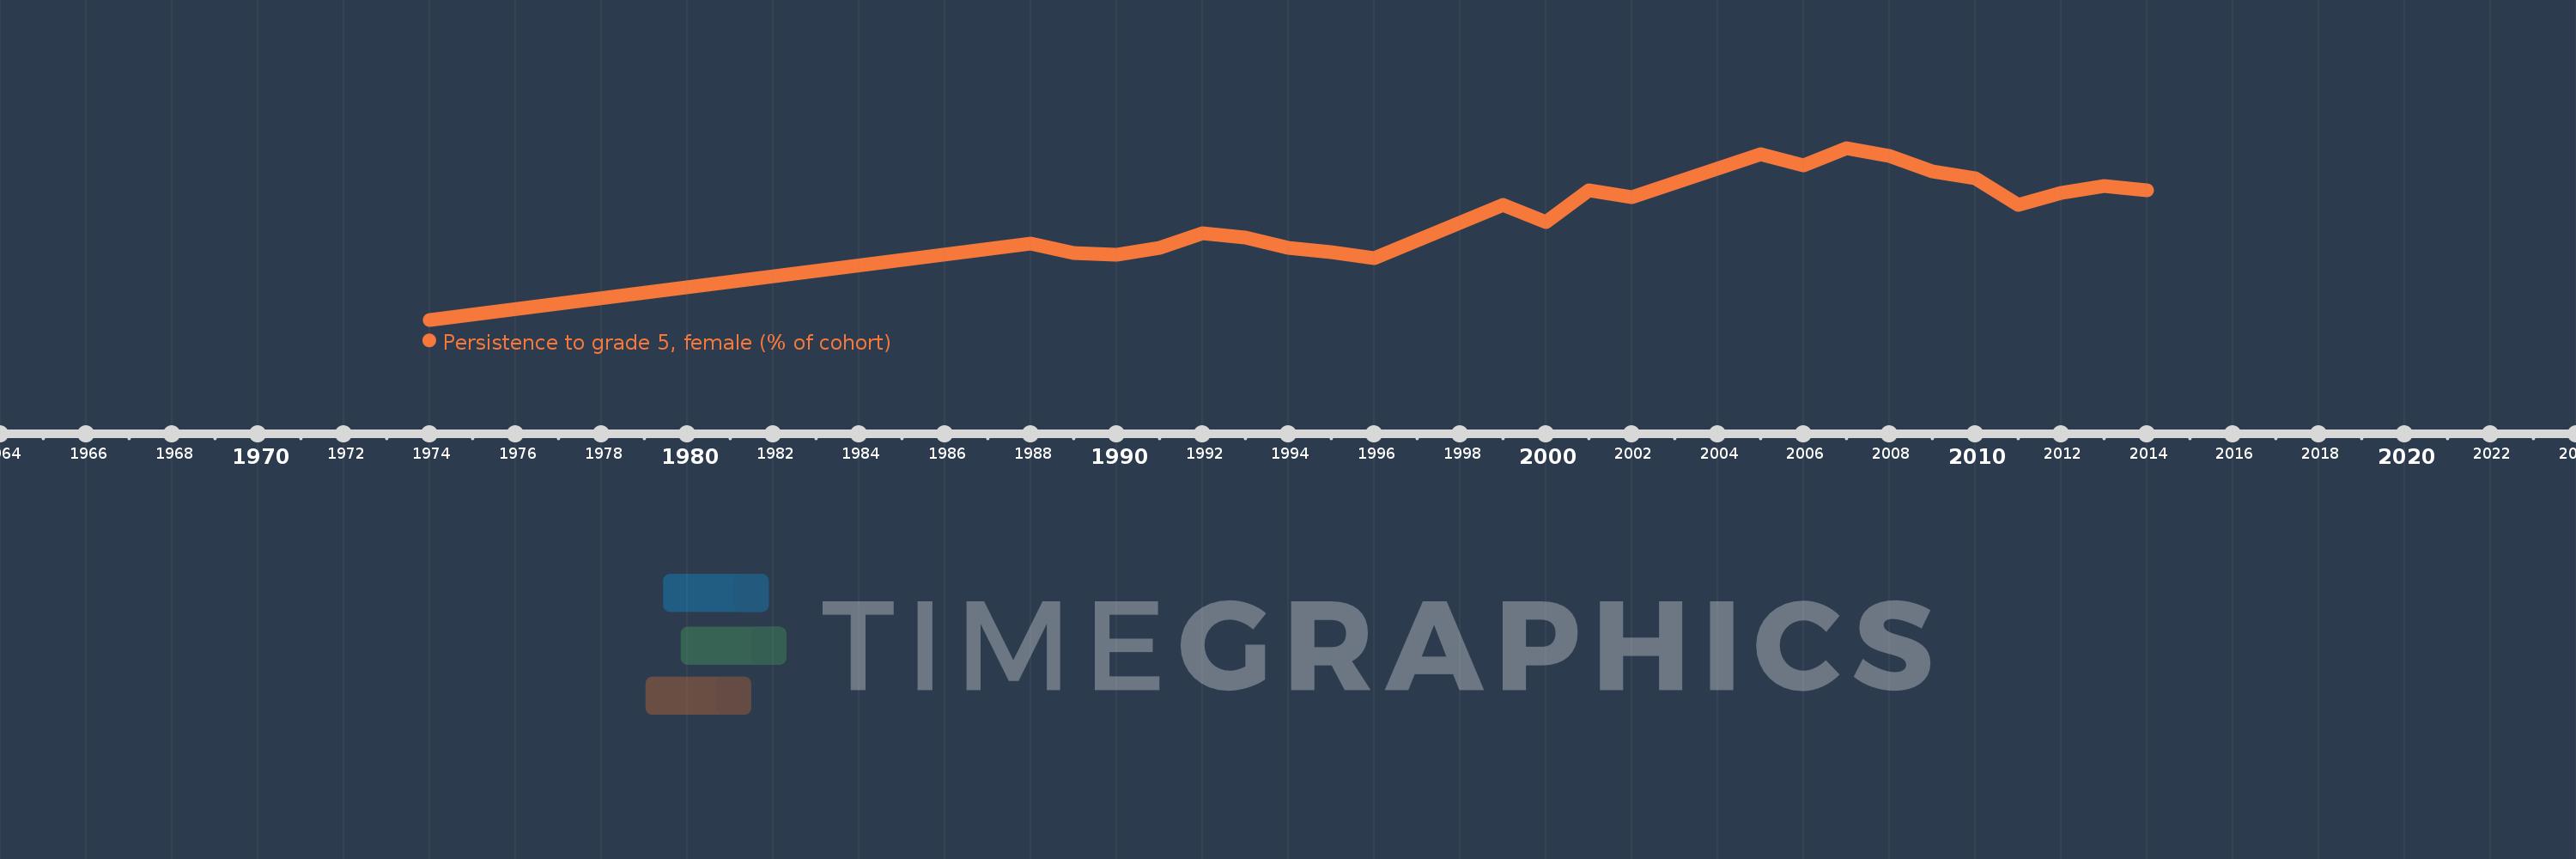
Persistence to grade 5, female (% of cohort)
2014,2013,2012,2011,2010,2009,2008,2007,2006,2005,2002,2001,2000,1999,1996,1995,1994,1993,1992,1991,1990,1989,1988,1974
Queste statistiche in altri paesi:
AfghanistanAlbaniaAlgeriaAndorraAngolaAntigua and BarbudaArab WorldArgentinaArubaBahamas, TheBahrainBangladeshBarbadosBelgiumBelizeBeninBermudaBhutanBoliviaBosnia and HerzegovinaBotswanaBrunei DarussalamBurkina FasoBurundiCabo VerdeCambodiaCameroonCanadaCaribbean small statesCayman IslandsCentral African RepublicChadChileChinaColombiaComorosCongo, Dem. Rep.Congo, Rep.Costa RicaCote d'IvoireCubaCyprusCzech RepublicDenmarkDjiboutiDominicaDominican RepublicEarly-demographic dividendEast Asia & PacificEast Asia & Pacific (excluding high income)East Asia & Pacific (IDA & IBRD countries)EcuadorEgypt, Arab Rep.El SalvadorEquatorial GuineaEritreaEstoniaEthiopiaFijiFinlandFranceGabonGambia, TheGeorgiaGhanaGreeceGrenadaGuatemalaGuineaGuinea-BissauGuyanaHaitiHeavily indebted poor countries (HIPC)HondurasHong Kong SAR, ChinaHungaryIcelandIDA blendIDA onlyIDA totalIndiaIndonesiaIran, Islamic Rep.IraqIrelandIsraelItalyJamaicaJapanJordanKenyaKiribatiKorea, Rep.KuwaitLao PDRLate-demographic dividendLatviaLeast developed countries: UN classificationLebanonLesothoLiberiaLibyaLiechtensteinLow incomeLower middle incomeLuxembourgMacao SAR, ChinaMadagascarMalawiMalaysiaMaldivesMaliMaltaMarshall IslandsMauritaniaMauritiusMexicoMiddle East & North AfricaMiddle East & North Africa (excluding high income)Middle East & North Africa (IDA & IBRD countries)MontenegroMoroccoMozambiqueMyanmarNamibiaNepalNetherlandsNicaraguaNigerNigeriaNorwayOmanOther small statesPacific island small statesPakistanPanamaPapua New GuineaParaguayPeruPhilippinesPolandPortugalPre-demographic dividendQatarRwandaSamoaSan MarinoSao Tome and PrincipeSaudi ArabiaSenegalSeychellesSierra LeoneSingaporeSloveniaSolomon IslandsSouth AfricaSouth AsiaSouth Asia (IDA & IBRD)SpainSri LankaSt. Kitts and NevisSt. LuciaSt. Vincent and the GrenadinesSub-Saharan Africa Sub-Saharan Africa (excluding high income)Sub-Saharan Africa (IDA & IBRD countries)SudanSurinameSwazilandSwedenSwitzerlandSyrian Arab RepublicTanzaniaThailandTimor-LesteTogoTongaTrinidad and TobagoTunisiaTurkeyUgandaUnited Arab EmiratesUpper middle incomeUruguayVanuatuVenezuela, RBVietnamYemen, Rep.ZambiaZimbabwe Linea del tempo:
Questa scala temporale mostra un grafico dal 1974 anno al 2014 anno. Mozambique. I dati fino ad 1973 anno non disponibili. Il numero di osservazioni attuali secondo i date: 24.
La fonte (nome):
Indicatori dello sviluppo mondiale
La fonte (organizzazione):
United Nations Educational, Scientific, and Cultural Organization (UNESCO) Institute for Statistics.
Categorie:
Education, Gender
sono stati aggiornati
23 apr 2017 anni
Indicatori delle variazioni dei valori per anni
Minima:
7.638
1 gen 1974 anni
Massimo:
60.403
1 gen 2007 anni
Alla data di osservazione
Valore
Variazione assoluta
La variazione rispetto al valore precedente
1 gen 1974 anni
7.638
+7.638
0.0%
1 gen 1988 anni
31.047
+23.408
306.46%
1 gen 1989 anni
28.149
-2.897
-9.33%
1 gen 1990 anni
27.671
-0.478
-1.7%
1 gen 1991 anni
29.591
+1.919
6.94%
1 gen 1992 anni
34.189
+4.598
15.54%
1 gen 1993 anni
32.929
-1.26
-3.68%
1 gen 1994 anni
29.763
-3.167
-9.62%
1 gen 1995 anni
28.507
-1.255
-4.22%
1 gen 1996 anni
26.442
-2.066
-7.25%
1 gen 1999 anni
42.787
+16.345
61.82%
1 gen 2000 anni
37.674
-5.113
-11.95%
1 gen 2001 anni
47.402
+9.728
25.82%
1 gen 2002 anni
45.344
-2.058
-4.34%
1 gen 2005 anni
58.385
+13.041
28.76%
1 gen 2006 anni
55.119
-3.266
-5.59%
1 gen 2007 anni
60.403
+5.284
9.59%
1 gen 2008 anni
57.974
-2.43
-4.02%
1 gen 2009 anni
53.276
-4.698
-8.1%
1 gen 2010 anni
51.115
-2.161
-4.06%
1 gen 2011 anni
42.802
-8.313
-16.26%
1 gen 2012 anni
46.569
+3.766
8.8%
1 gen 2013 anni
48.612
+2.043
4.39%
1 gen 2014 anni
47.452
-1.16
-2.39%
Classificazione dei paesi secondo i statistiche attuali per anni


Commenti: