30
/es/
AIzaSyAYiBZKx7MnpbEhh9jyipgxe19OcubqV5w
April 1, 2024
114059
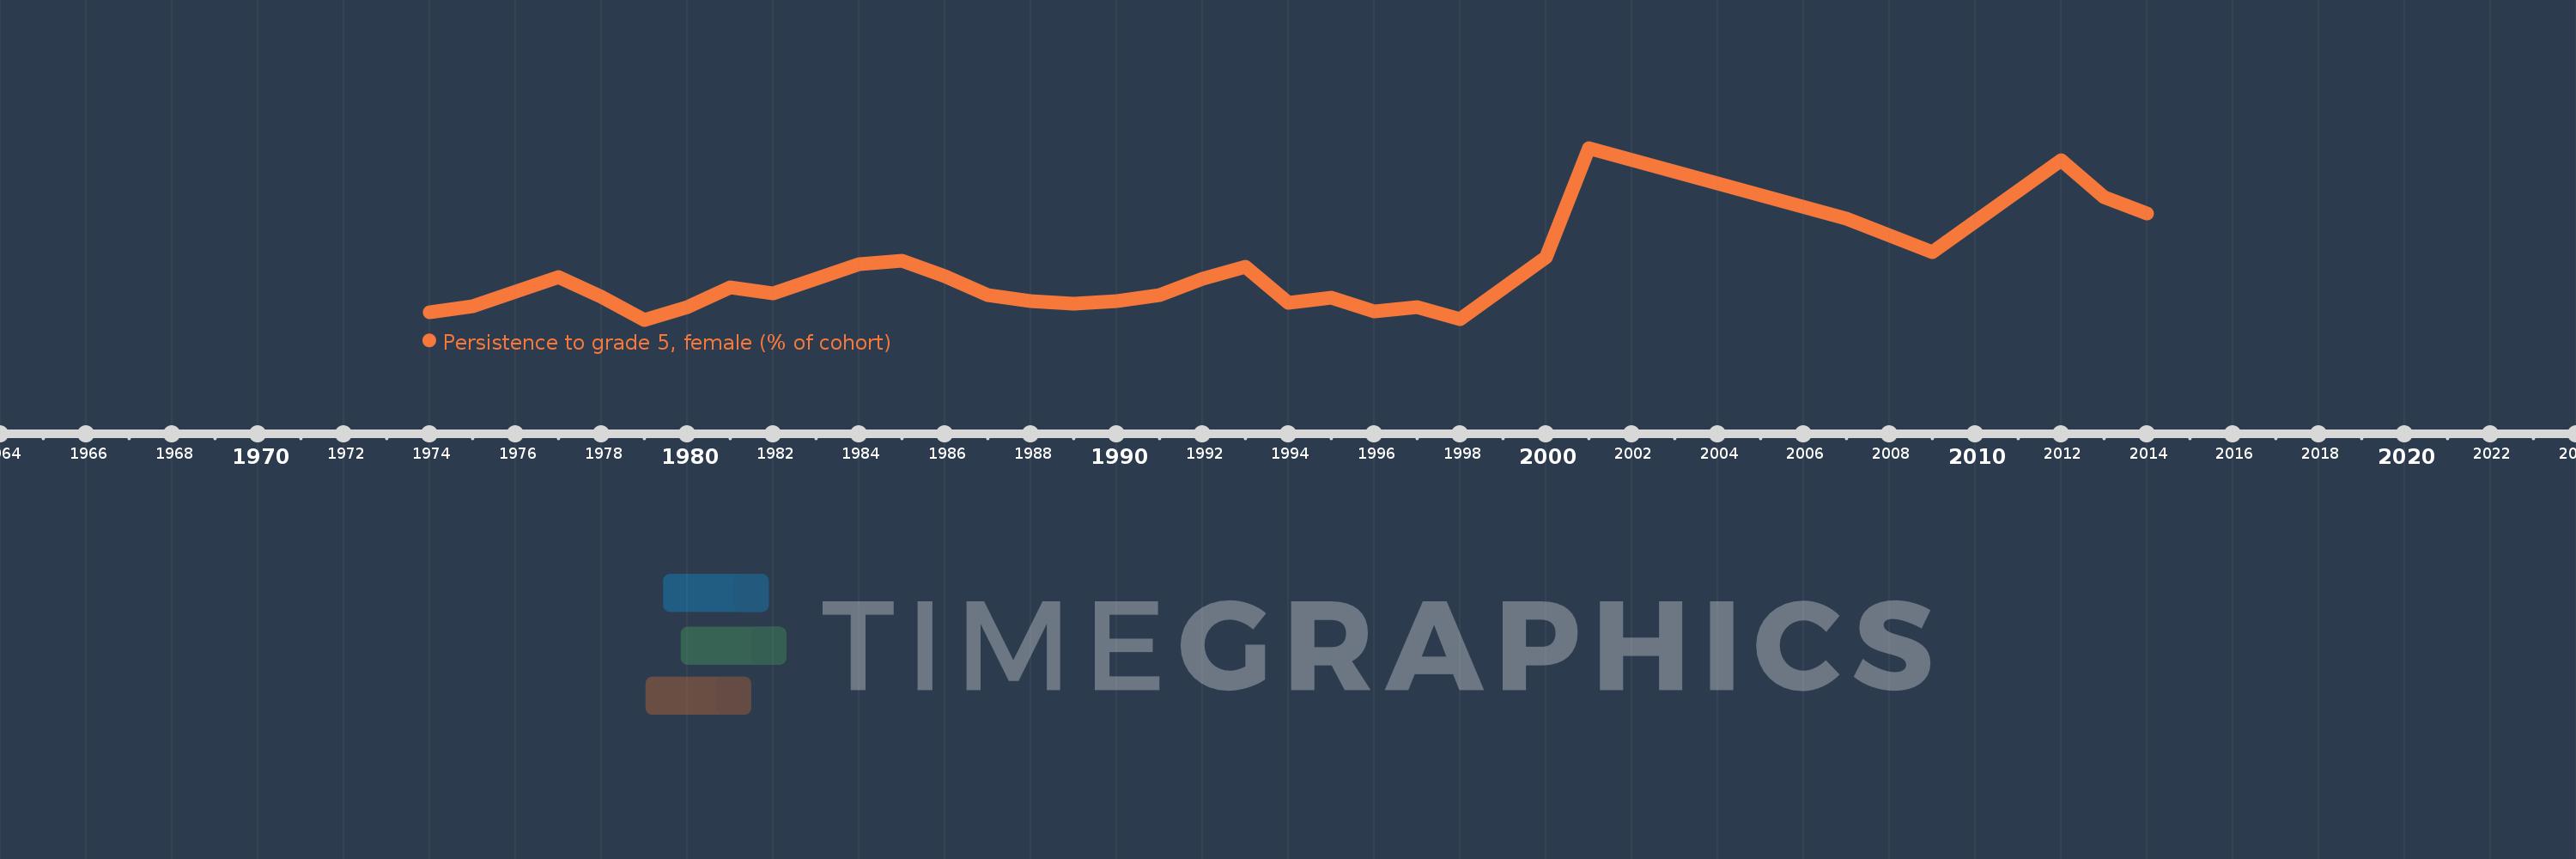
Cote d'Ivoire
CIV
true
2
1
Persistence to grade 5, female (% of cohort)
2014,2013,2012,2009,2007,2001,2000,1998,1997,1996,1995,1994,1993,1992,1991,1990,1989,1988,1987,1986,1985,1984,1982,1981,1980,1979,1978,1977,1975,1974
