29
/fr/
fr
AIzaSyAYiBZKx7MnpbEhh9jyipgxe19OcubqV5w
April 1, 2024
96581
Burundi
BDI
true
2
1
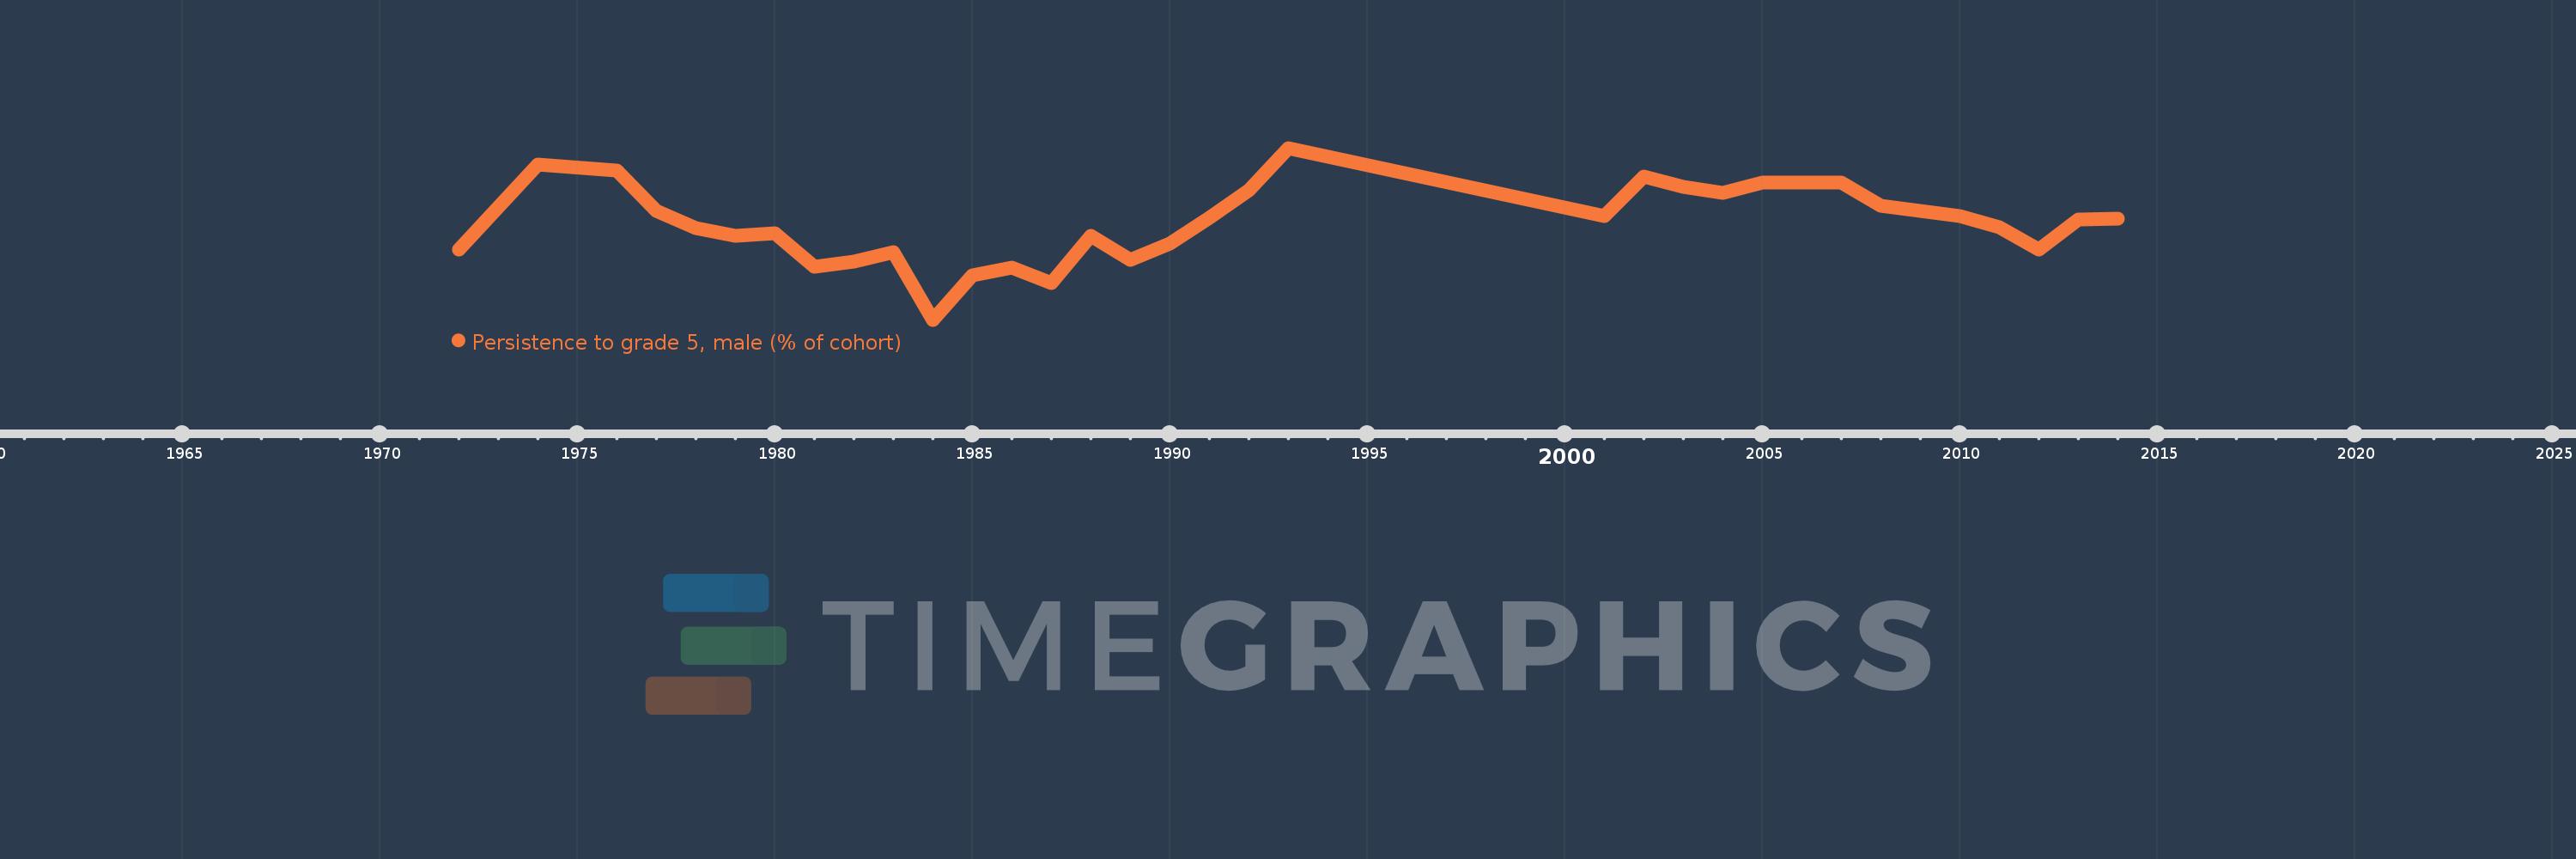
Persistence to grade 5, male (% of cohort)
2014,2013,2012,2011,2010,2008,2007,2005,2004,2003,2002,2001,1993,1992,1991,1990,1989,1988,1987,1986,1985,1984,1983,1982,1981,1980,1979,1978,1977,1976,1974,1972
Cette statistique dans les autres pays:
AfghanistanAlbaniaAlgeriaAndorraAngolaAntigua and BarbudaArab WorldArgentinaArubaBahamas, TheBahrainBangladeshBarbadosBelgiumBelizeBeninBermudaBhutanBoliviaBosnia and HerzegovinaBotswanaBrunei DarussalamBurkina FasoBurundiCabo VerdeCambodiaCameroonCanadaCaribbean small statesCayman IslandsCentral African RepublicChadChileChinaColombiaComorosCongo, Dem. Rep.Congo, Rep.Costa RicaCote d'IvoireCubaCyprusCzech RepublicDenmarkDjiboutiDominicaDominican RepublicEarly-demographic dividendEast Asia & PacificEast Asia & Pacific (excluding high income)East Asia & Pacific (IDA & IBRD countries)EcuadorEgypt, Arab Rep.El SalvadorEquatorial GuineaEritreaEstoniaEthiopiaFijiFinlandFranceGabonGambia, TheGeorgiaGhanaGreeceGrenadaGuatemalaGuineaGuinea-BissauGuyanaHaitiHeavily indebted poor countries (HIPC)HondurasHong Kong SAR, ChinaHungaryIcelandIDA blendIDA onlyIDA totalIndiaIndonesiaIran, Islamic Rep.IraqIrelandIsraelItalyJamaicaJapanJordanKenyaKiribatiKorea, Rep.KuwaitLao PDRLate-demographic dividendLatviaLeast developed countries: UN classificationLebanonLesothoLiberiaLibyaLiechtensteinLow incomeLower middle incomeLuxembourgMacao SAR, ChinaMadagascarMalawiMalaysiaMaldivesMaliMaltaMarshall IslandsMauritaniaMauritiusMexicoMiddle East & North AfricaMiddle East & North Africa (excluding high income)Middle East & North Africa (IDA & IBRD countries)MontenegroMoroccoMozambiqueMyanmarNamibiaNepalNetherlandsNicaraguaNigerNigeriaNorwayOmanOther small statesPacific island small statesPakistanPanamaPapua New GuineaParaguayPeruPhilippinesPolandPortugalPre-demographic dividendQatarRwandaSamoaSan MarinoSao Tome and PrincipeSaudi ArabiaSenegalSeychellesSierra LeoneSingaporeSloveniaSolomon IslandsSouth AfricaSouth AsiaSouth Asia (IDA & IBRD)SpainSri LankaSt. Kitts and NevisSt. LuciaSt. Vincent and the GrenadinesSub-Saharan Africa Sub-Saharan Africa (excluding high income)Sub-Saharan Africa (IDA & IBRD countries)SudanSurinameSwazilandSwedenSwitzerlandSyrian Arab RepublicTanzaniaThailandTimor-LesteTogoTongaTrinidad and TobagoTunisiaTurkeyUgandaUnited Arab EmiratesUpper middle incomeUruguayVanuatuVenezuela, RBVietnamYemen, Rep.ZambiaZimbabwe La ligne de temps
Cette échelle de temps montre un graphique de 1972 année à 2014 année Burundi. Les données jusqu'à 1971 année ne sont pas présentés. Quantité d'observations actuelles selon dates: 32.
Source (désignation):
Les indicateurs du développement mondiale
Source (organisation):
United Nations Educational, Scientific, and Cultural Organization (UNESCO) Institute for Statistics.
Catégories:
Education, Gender
Dernière mise à jour
23 avr. 2017
Les indicateurs de changement de valeurs selon les années
Minimum:
33.446
1 janv. 1984
Maximum:
76.22
1 janv. 1993
Pour la date d''observation
Valeur
Changement absolu
Le changement par rapport à la valeur précédente
1 janv. 1972
51.006
+51.006
0.0%
1 janv. 1974
72.023
+21.017
41.21%
1 janv. 1976
70.609
-1.414
-1.96%
1 janv. 1977
60.536
-10.073
-14.27%
1 janv. 1978
56.22
-4.316
-7.13%
1 janv. 1979
54.409
-1.811
-3.22%
1 janv. 1980
55.034
+0.625
1.15%
1 janv. 1981
46.614
-8.42
-15.3%
1 janv. 1982
47.891
+1.276
2.74%
1 janv. 1983
50.183
+2.292
4.79%
1 janv. 1984
33.446
-16.737
-33.35%
1 janv. 1985
44.472
+11.026
32.97%
1 janv. 1986
46.379
+1.908
4.29%
1 janv. 1987
42.518
-3.861
-8.33%
1 janv. 1988
54.393
+11.875
27.93%
1 janv. 1989
48.316
-6.076
-11.17%
1 janv. 1990
52.507
+4.191
8.67%
1 janv. 1991
58.923
+6.415
12.22%
1 janv. 1992
65.644
+6.721
11.41%
1 janv. 1993
76.22
+10.577
16.11%
1 janv. 2001
59.258
-16.962
-22.25%
1 janv. 2002
69.104
+9.846
16.61%
1 janv. 2003
66.548
-2.557
-3.7%
1 janv. 2004
64.964
-1.584
-2.38%
1 janv. 2005
67.56
+2.596
4.0%
1 janv. 2007
67.505
-0.056
-0.08%
1 janv. 2008
61.872
-5.633
-8.34%
1 janv. 2010
59.188
-2.683
-4.34%
1 janv. 2011
56.574
-2.614
-4.42%
1 janv. 2012
50.969
-5.605
-9.91%
1 janv. 2013
58.363
+7.394
14.51%
1 janv. 2014
58.568
+0.206
0.35%
Classement des pays selon les statistiques actuelles par années


Commentaires: