30
/fr/
AIzaSyAYiBZKx7MnpbEhh9jyipgxe19OcubqV5w
April 1, 2024
261382
Tanzania
TZA
true
2
1
Persistence to grade 5, male (% of cohort)
2013,2010,2009,2007,2006,2005,2004,2002,2001,2000,1999,1998,1995,1994,1993,1992,1990,1989,1988,1987,1985,1977,1976
Download
Bibliothèque de statistiques globales →Tanzania →

Persistence to grade 5, male (% of cohort)

Cette statistique dans les autres pays:

AfghanistanAlbaniaAlgeriaAndorraAngolaAntigua and BarbudaArab WorldArgentinaArubaBahamas, TheBahrainBangladeshBarbadosBelgiumBelizeBeninBermudaBhutanBoliviaBosnia and HerzegovinaBotswanaBrunei DarussalamBurkina FasoBurundiCabo VerdeCambodiaCameroonCanadaCaribbean small statesCayman IslandsCentral African RepublicChadChileChinaColombiaComorosCongo, Dem. Rep.Congo, Rep.Costa RicaCote d'IvoireCubaCyprusCzech RepublicDenmarkDjiboutiDominicaDominican RepublicEarly-demographic dividendEast Asia & PacificEast Asia & Pacific (excluding high income)East Asia & Pacific (IDA & IBRD countries)EcuadorEgypt, Arab Rep.El SalvadorEquatorial GuineaEritreaEstoniaEthiopiaFijiFinlandFranceGabonGambia, TheGeorgiaGhanaGreeceGrenadaGuatemalaGuineaGuinea-BissauGuyanaHaitiHeavily indebted poor countries (HIPC)HondurasHong Kong SAR, ChinaHungaryIcelandIDA blendIDA onlyIDA totalIndiaIndonesiaIran, Islamic Rep.IraqIrelandIsraelItalyJamaicaJapanJordanKenyaKiribatiKorea, Rep.KuwaitLao PDRLate-demographic dividendLatviaLeast developed countries: UN classificationLebanonLesothoLiberiaLibyaLiechtensteinLow incomeLower middle incomeLuxembourgMacao SAR, ChinaMadagascarMalawiMalaysiaMaldivesMaliMaltaMarshall IslandsMauritaniaMauritiusMexicoMiddle East & North AfricaMiddle East & North Africa (excluding high income)Middle East & North Africa (IDA & IBRD countries)MontenegroMoroccoMozambiqueMyanmarNamibiaNepalNetherlandsNicaraguaNigerNigeriaNorwayOmanOther small statesPacific island small statesPakistanPanamaPapua New GuineaParaguayPeruPhilippinesPolandPortugalPre-demographic dividendQatarRwandaSamoaSan MarinoSao Tome and PrincipeSaudi ArabiaSenegalSeychellesSierra LeoneSingaporeSloveniaSolomon IslandsSouth AfricaSouth AsiaSouth Asia (IDA & IBRD)SpainSri LankaSt. Kitts and NevisSt. LuciaSt. Vincent and the GrenadinesSub-Saharan Africa Sub-Saharan Africa (excluding high income)Sub-Saharan Africa (IDA & IBRD countries)SudanSurinameSwazilandSwedenSwitzerlandSyrian Arab RepublicTanzaniaThailandTimor-LesteTogoTongaTrinidad and TobagoTunisiaTurkeyUgandaUnited Arab EmiratesUpper middle incomeUruguayVanuatuVenezuela, RBVietnamYemen, Rep.ZambiaZimbabwe

La ligne de temps

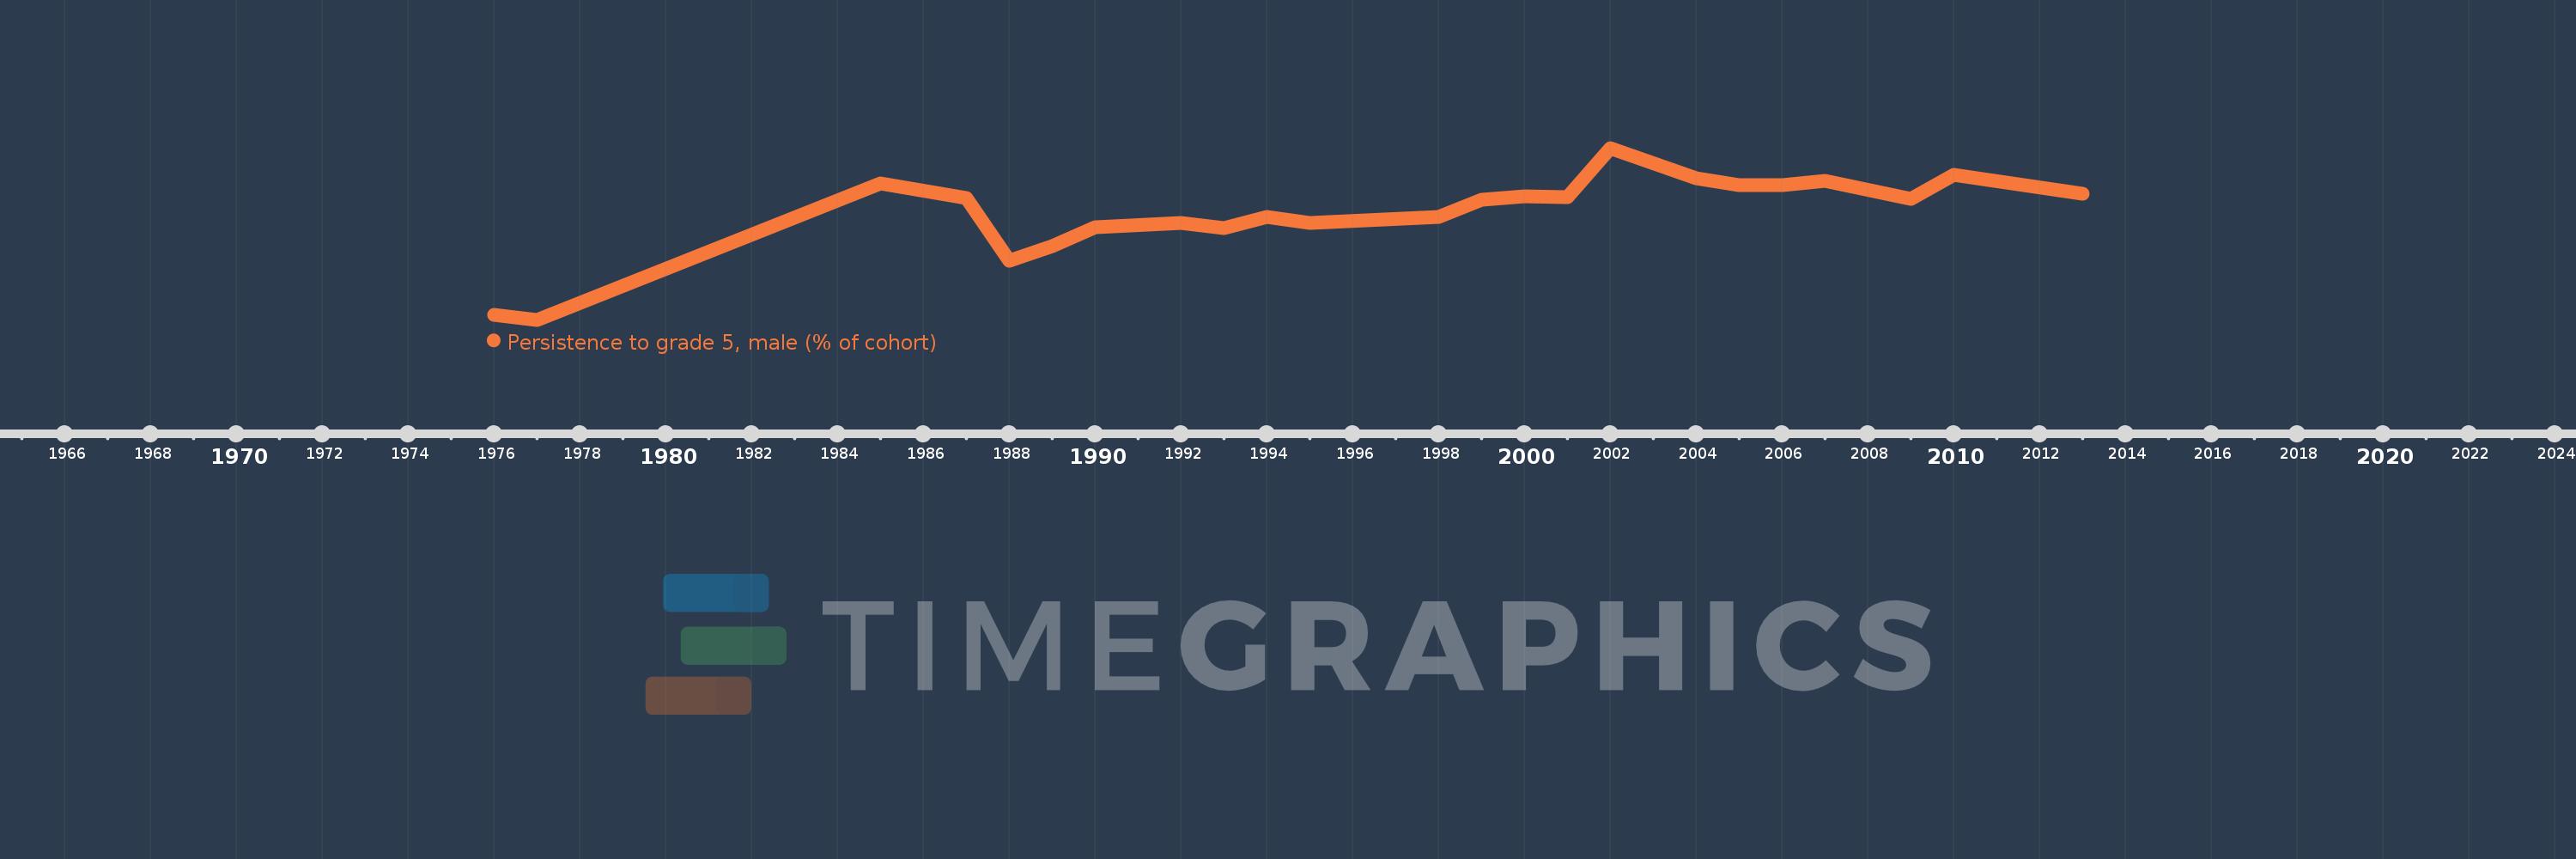
Cette échelle de temps montre un graphique de 1976 année à 2013 année Tanzania. Les données jusqu'à 1975 année ne sont pas présentés. Quantité d'observations actuelles selon dates: 23.

Source (désignation):

Les indicateurs du développement mondiale

Source (organisation):

United Nations Educational, Scientific, and Cultural Organization (UNESCO) Institute for Statistics.

Catégories:

Education, Gender

Dernière mise à jour

23 avr. 2017

Les indicateurs de changement de valeurs selon les années

En moyenne:
74.09
Minimum:
37.358
1 janv. 1977
Maximum:
96.366
1 janv. 2002
Pour la date d''observation
Valeur
Changement absolu
Le changement par rapport à la valeur précédente
1 janv. 1976
38.984
+38.984
0.0%
1 janv. 1977
37.358
-1.626
-4.17%
1 janv. 1985
84.244
+46.886
125.5%
1 janv. 1987
79.13
-5.114
-6.07%
1 janv. 1988
57.623
-21.507
-27.18%
1 janv. 1989
62.745
+5.123
8.89%
1 janv. 1990
69.266
+6.52
10.39%
1 janv. 1992
70.64
+1.374
1.98%
1 janv. 1993
68.824
-1.815
-2.57%
1 janv. 1994
72.749
+3.925
5.7%
1 janv. 1995
70.573
-2.176
-2.99%
1 janv. 1998
72.795
+2.222
3.15%
1 janv. 1999
78.668
+5.873
8.07%
1 janv. 2000
79.788
+1.12
1.42%
1 janv. 2001
79.527
-0.261
-0.33%
1 janv. 2002
96.366
+16.839
21.17%
1 janv. 2004
86.063
-10.303
-10.69%
1 janv. 2005
83.67
-2.393
-2.78%
1 janv. 2006
83.569
-0.101
-0.12%
1 janv. 2007
84.924
+1.355
1.62%
1 janv. 2009
78.776
-6.148
-7.24%
1 janv. 2010
87.044
+8.268
10.5%
1 janv. 2013
80.733
-6.311
-7.25%

Classement des pays selon les statistiques actuelles par années