29
/fr/
fr
AIzaSyAYiBZKx7MnpbEhh9jyipgxe19OcubqV5w
April 1, 2024
112737
Costa Rica
CRI
true
2
1
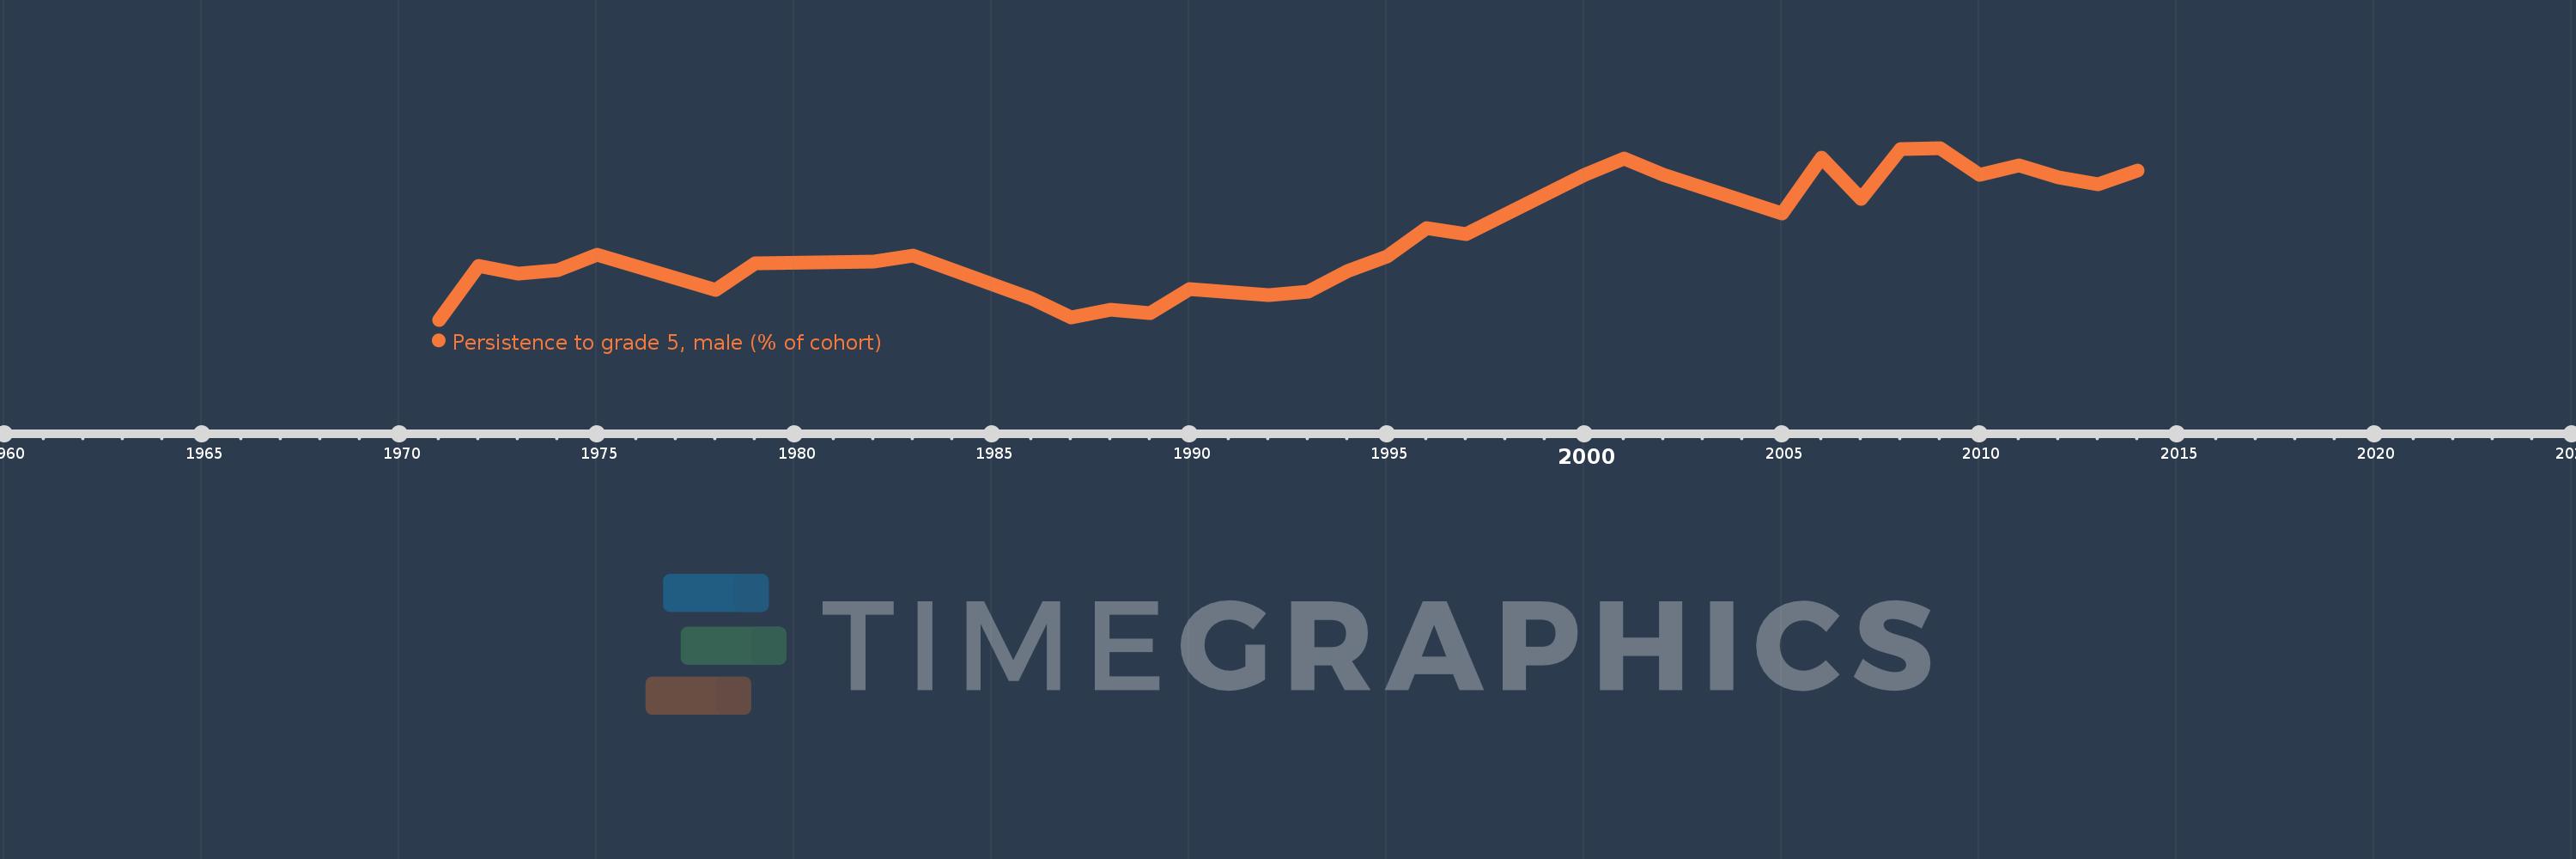
Persistence to grade 5, male (% of cohort)
2014,2013,2012,2011,2010,2009,2008,2007,2006,2005,2002,2001,2000,1997,1996,1995,1994,1993,1992,1990,1989,1988,1987,1986,1983,1982,1979,1978,1975,1974,1973,1972,1971
Cette statistique dans les autres pays:
AfghanistanAlbaniaAlgeriaAndorraAngolaAntigua and BarbudaArab WorldArgentinaArubaBahamas, TheBahrainBangladeshBarbadosBelgiumBelizeBeninBermudaBhutanBoliviaBosnia and HerzegovinaBotswanaBrunei DarussalamBurkina FasoBurundiCabo VerdeCambodiaCameroonCanadaCaribbean small statesCayman IslandsCentral African RepublicChadChileChinaColombiaComorosCongo, Dem. Rep.Congo, Rep.Costa RicaCote d'IvoireCubaCyprusCzech RepublicDenmarkDjiboutiDominicaDominican RepublicEarly-demographic dividendEast Asia & PacificEast Asia & Pacific (excluding high income)East Asia & Pacific (IDA & IBRD countries)EcuadorEgypt, Arab Rep.El SalvadorEquatorial GuineaEritreaEstoniaEthiopiaFijiFinlandFranceGabonGambia, TheGeorgiaGhanaGreeceGrenadaGuatemalaGuineaGuinea-BissauGuyanaHaitiHeavily indebted poor countries (HIPC)HondurasHong Kong SAR, ChinaHungaryIcelandIDA blendIDA onlyIDA totalIndiaIndonesiaIran, Islamic Rep.IraqIrelandIsraelItalyJamaicaJapanJordanKenyaKiribatiKorea, Rep.KuwaitLao PDRLate-demographic dividendLatviaLeast developed countries: UN classificationLebanonLesothoLiberiaLibyaLiechtensteinLow incomeLower middle incomeLuxembourgMacao SAR, ChinaMadagascarMalawiMalaysiaMaldivesMaliMaltaMarshall IslandsMauritaniaMauritiusMexicoMiddle East & North AfricaMiddle East & North Africa (excluding high income)Middle East & North Africa (IDA & IBRD countries)MontenegroMoroccoMozambiqueMyanmarNamibiaNepalNetherlandsNicaraguaNigerNigeriaNorwayOmanOther small statesPacific island small statesPakistanPanamaPapua New GuineaParaguayPeruPhilippinesPolandPortugalPre-demographic dividendQatarRwandaSamoaSan MarinoSao Tome and PrincipeSaudi ArabiaSenegalSeychellesSierra LeoneSingaporeSloveniaSolomon IslandsSouth AfricaSouth AsiaSouth Asia (IDA & IBRD)SpainSri LankaSt. Kitts and NevisSt. LuciaSt. Vincent and the GrenadinesSub-Saharan Africa Sub-Saharan Africa (excluding high income)Sub-Saharan Africa (IDA & IBRD countries)SudanSurinameSwazilandSwedenSwitzerlandSyrian Arab RepublicTanzaniaThailandTimor-LesteTogoTongaTrinidad and TobagoTunisiaTurkeyUgandaUnited Arab EmiratesUpper middle incomeUruguayVanuatuVenezuela, RBVietnamYemen, Rep.ZambiaZimbabwe La ligne de temps
Cette échelle de temps montre un graphique de 1971 année à 2014 année Costa Rica. Les données jusqu'à 1970 année ne sont pas présentés. Quantité d'observations actuelles selon dates: 33.
Source (désignation):
Les indicateurs du développement mondiale
Source (organisation):
United Nations Educational, Scientific, and Cultural Organization (UNESCO) Institute for Statistics.
Catégories:
Education, Gender
Dernière mise à jour
23 avr. 2017
Les indicateurs de changement de valeurs selon les années
Minimum:
66.274
1 janv. 1971
Maximum:
94.634
1 janv. 2009
Pour la date d''observation
Valeur
Changement absolu
Le changement par rapport à la valeur précédente
1 janv. 1971
66.274
+66.274
0.0%
1 janv. 1972
75.157
+8.883
13.4%
1 janv. 1973
73.951
-1.206
-1.6%
1 janv. 1974
74.386
+0.435
0.59%
1 janv. 1975
76.988
+2.602
3.5%
1 janv. 1978
71.15
-5.838
-7.58%
1 janv. 1979
75.532
+4.383
6.16%
1 janv. 1982
75.821
+0.289
0.38%
1 janv. 1983
76.909
+1.088
1.43%
1 janv. 1986
69.719
-7.19
-9.35%
1 janv. 1987
66.629
-3.09
-4.43%
1 janv. 1988
67.907
+1.278
1.92%
1 janv. 1989
67.301
-0.606
-0.89%
1 janv. 1990
71.278
+3.977
5.91%
1 janv. 1992
70.298
-0.981
-1.38%
1 janv. 1993
70.897
+0.599
0.85%
1 janv. 1994
74.269
+3.372
4.76%
1 janv. 1995
76.678
+2.409
3.24%
1 janv. 1996
81.341
+4.662
6.08%
1 janv. 1997
80.371
-0.97
-1.19%
1 janv. 2000
90.127
+9.757
12.14%
1 janv. 2001
92.832
+2.704
3.0%
1 janv. 2002
90.219
-2.613
-2.81%
1 janv. 2005
83.761
-6.457
-7.16%
1 janv. 2006
93.021
+9.26
11.06%
1 janv. 2007
86.156
-6.866
-7.38%
1 janv. 2008
94.461
+8.305
9.64%
1 janv. 2009
94.634
+0.173
0.18%
1 janv. 2010
90.241
-4.393
-4.64%
1 janv. 2011
91.692
+1.451
1.61%
1 janv. 2012
89.783
-1.909
-2.08%
1 janv. 2013
88.702
-1.081
-1.2%
1 janv. 2014
90.935
+2.232
2.52%
Classement des pays selon les statistiques actuelles par années


Commentaires: