29
/fr/
fr
AIzaSyAYiBZKx7MnpbEhh9jyipgxe19OcubqV5w
April 1, 2024
95749
Burundi
BDI
true
2
1
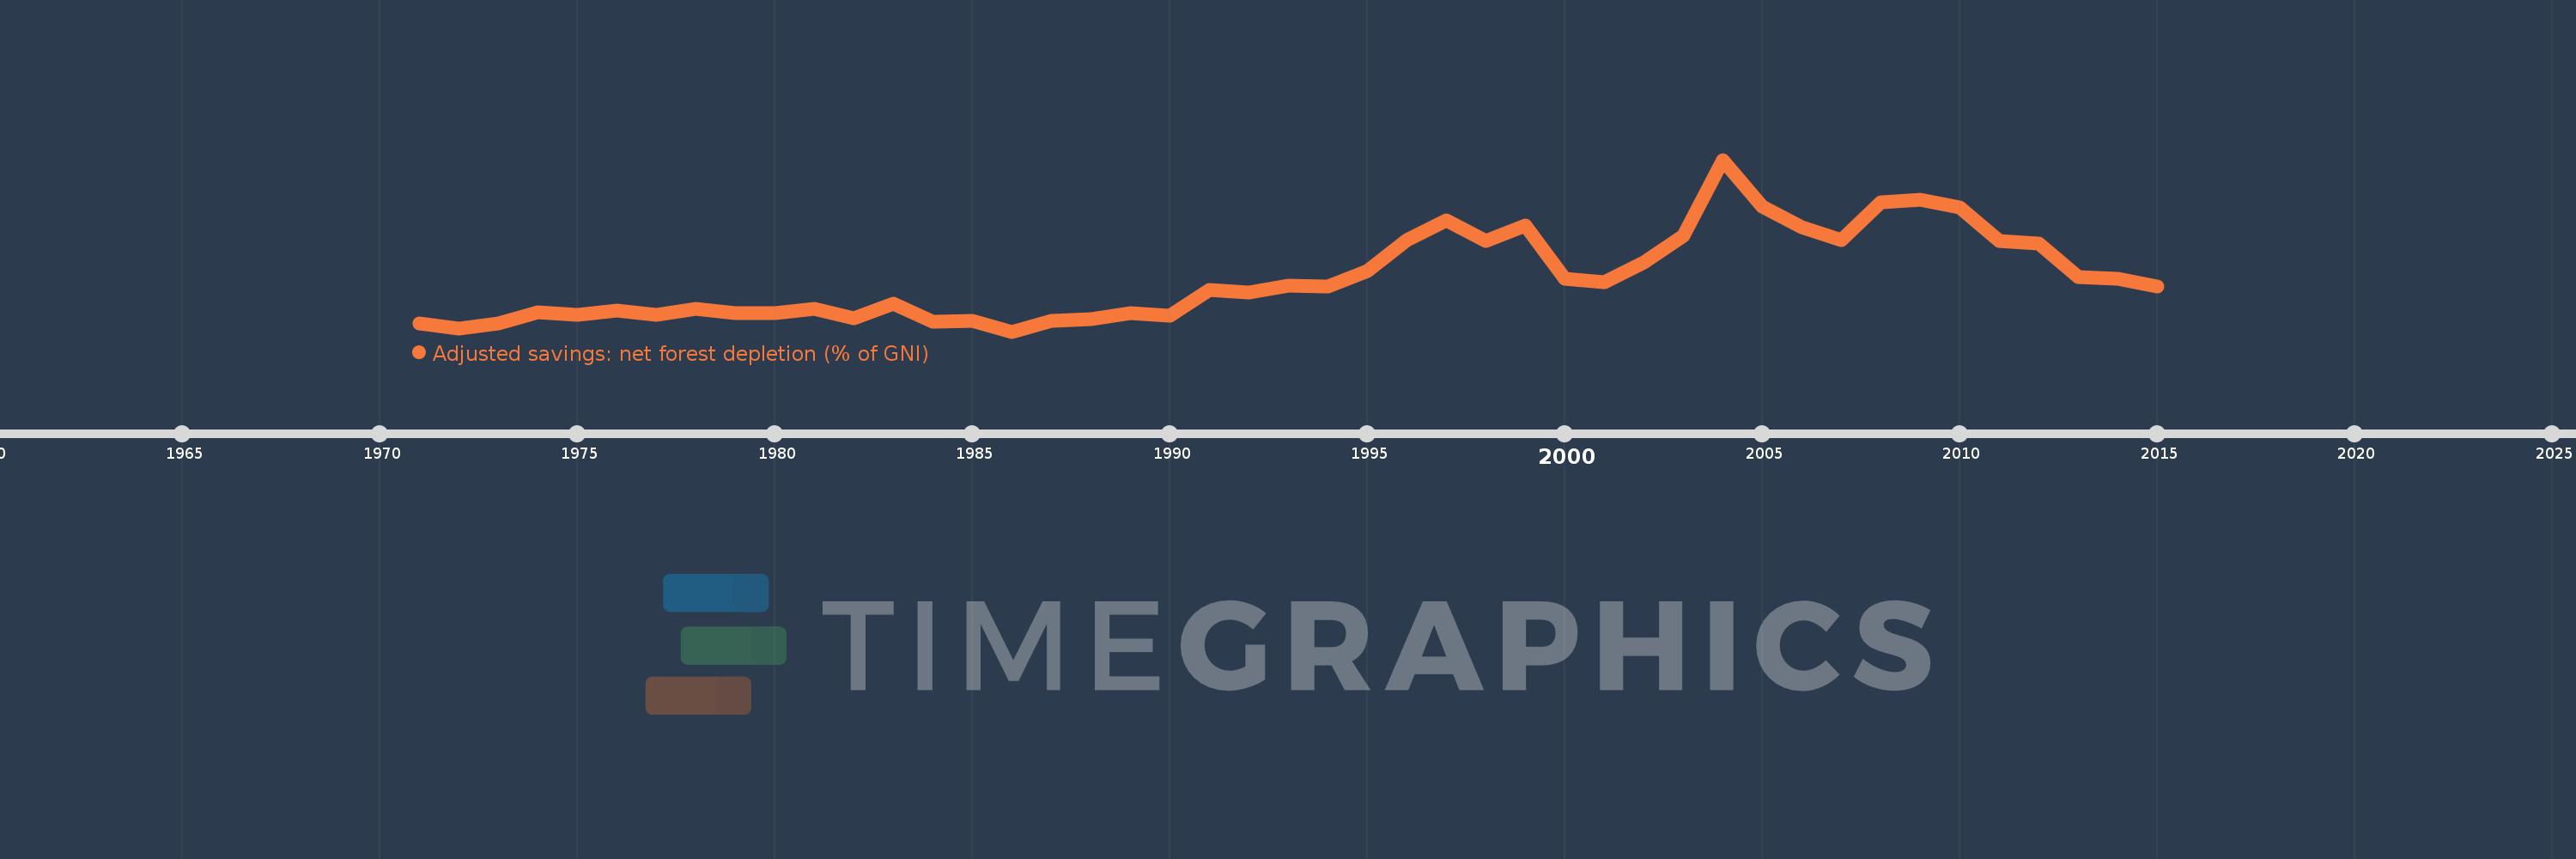
Adjusted savings: net forest depletion (% of GNI)
2015,2014,2013,2012,2011,2010,2009,2008,2007,2006,2005,2004,2003,2002,2001,2000,1999,1998,1997,1996,1995,1994,1993,1992,1991,1990,1989,1988,1987,1986,1985,1984,1983,1982,1981,1980,1979,1978,1977,1976,1975,1974,1973,1972,1971
Cette statistique dans les autres pays:
AfghanistanAlbaniaAlgeriaAngolaArab WorldArgentinaArmeniaAustraliaAustriaAzerbaijanBahamas, TheBahrainBangladeshBarbadosBelarusBelgiumBelizeBeninBhutanBoliviaBotswanaBrazilBrunei DarussalamBulgariaBurkina FasoBurundiCabo VerdeCambodiaCameroonCanadaCaribbean small statesCentral African RepublicCentral Europe and the BalticsChadChileChinaColombiaComorosCongo, Dem. Rep.Congo, Rep.Costa RicaCote d'IvoireCroatiaCubaCyprusCzech RepublicDenmarkDjiboutiDominicaDominican RepublicEarly-demographic dividendEast Asia & PacificEast Asia & Pacific (excluding high income)East Asia & Pacific (IDA & IBRD countries)EcuadorEgypt, Arab Rep.El SalvadorEquatorial GuineaEritreaEstoniaEthiopiaEuro areaEurope & Central AsiaEurope & Central Asia (excluding high income)Europe & Central Asia (IDA & IBRD countries)European UnionFijiFinlandFragile and conflict affected situationsFranceFrench PolynesiaGabonGambia, TheGeorgiaGermanyGhanaGreeceGuatemalaGuineaGuinea-BissauGuyanaHaitiHeavily indebted poor countries (HIPC)High incomeHondurasHong Kong SAR, ChinaHungaryIBRD onlyIcelandIDA & IBRD totalIDA blendIDA onlyIDA totalIndiaIndonesiaIran, Islamic Rep.IraqIrelandIsraelItalyJamaicaJapanJordanKazakhstanKenyaKiribatiKorea, Rep.KuwaitKyrgyz RepublicLao PDRLate-demographic dividendLatin America & Caribbean Latin America & Caribbean (excluding high income)Latin America & the Caribbean (IDA & IBRD countries)LatviaLeast developed countries: UN classificationLebanonLesothoLiberiaLibyaLithuaniaLow & middle incomeLow incomeLower middle incomeLuxembourgMacedonia, FYRMadagascarMalawiMalaysiaMaldivesMaliMauritaniaMauritiusMexicoMicronesia, Fed. Sts.Middle East & North AfricaMiddle East & North Africa (excluding high income)Middle East & North Africa (IDA & IBRD countries)Middle incomeMoldovaMongoliaMoroccoMozambiqueMyanmarNamibiaNepalNetherlandsNew CaledoniaNew ZealandNicaraguaNigerNigeriaNorth AmericaNorwayOECD membersOmanOther small statesPacific island small statesPakistanPanamaPapua New GuineaParaguayPeruPhilippinesPolandPortugalPost-demographic dividendPre-demographic dividendQatarRomaniaRussian FederationRwandaSamoaSao Tome and PrincipeSaudi ArabiaSenegalSeychellesSierra LeoneSingaporeSlovak RepublicSloveniaSmall statesSolomon IslandsSomaliaSouth AfricaSouth AsiaSouth Asia (IDA & IBRD)SpainSri LankaSt. LuciaSt. Vincent and the GrenadinesSub-Saharan Africa Sub-Saharan Africa (excluding high income)Sub-Saharan Africa (IDA & IBRD countries)SudanSurinameSwazilandSwedenSwitzerlandSyrian Arab RepublicTajikistanTanzaniaThailandTogoTongaTrinidad and TobagoTunisiaTurkeyTurkmenistanUgandaUkraineUnited Arab EmiratesUnited KingdomUnited StatesUpper middle incomeUruguayUzbekistanVanuatuVenezuela, RBVietnamWorldYemen, Rep.ZambiaZimbabwe La ligne de temps
Cette échelle de temps montre un graphique de 1971 année à 2015 année Burundi. Les données jusqu'à 1970 année ne sont pas présentés. Quantité d'observations actuelles selon dates: 45.
Source (désignation):
Les indicateurs du développement mondiale
Source (organisation):
World Bank staff estimates based on sources and methods in World Bank's "The Changing Wealth of Nations: Measuring Sustainable Development in the New Millennium" (2011).
Catégories:
Economy & Growth, Environment
Dernière mise à jour
23 avr. 2017
Les indicateurs de changement de valeurs selon les années
Minimum:
3.823
1 janv. 1986
Maximum:
40.891
1 janv. 2004
Pour la date d''observation
Valeur
Changement absolu
Le changement par rapport à la valeur précédente
1 janv. 1971
5.598
+5.598
0.0%
1 janv. 1972
4.517
-1.081
-19.3%
1 janv. 1973
5.582
+1.065
23.58%
1 janv. 1974
7.944
+2.362
42.31%
1 janv. 1975
7.48
-0.464
-5.84%
1 janv. 1976
8.404
+0.924
12.36%
1 janv. 1977
7.387
-1.017
-12.11%
1 janv. 1978
8.797
+1.41
19.09%
1 janv. 1979
7.795
-1.002
-11.39%
1 janv. 1980
7.825
+0.03
0.38%
1 janv. 1981
8.698
+0.873
11.16%
1 janv. 1982
6.743
-1.955
-22.48%
1 janv. 1983
9.83
+3.087
45.79%
1 janv. 1984
5.969
-3.861
-39.27%
1 janv. 1985
6.186
+0.217
3.64%
1 janv. 1986
3.823
-2.363
-38.2%
1 janv. 1987
6.115
+2.292
59.95%
1 janv. 1988
6.478
+0.363
5.93%
1 janv. 1989
7.738
+1.261
19.46%
1 janv. 1990
7.331
-0.408
-5.27%
1 janv. 1991
12.822
+5.492
74.91%
1 janv. 1992
12.321
-0.501
-3.91%
1 janv. 1993
13.674
+1.353
10.98%
1 janv. 1994
13.522
-0.152
-1.11%
1 janv. 1995
16.834
+3.312
24.49%
1 janv. 1996
23.48
+6.646
39.48%
1 janv. 1997
27.858
+4.378
18.65%
1 janv. 1998
23.412
-4.446
-15.96%
1 janv. 1999
26.749
+3.337
14.25%
1 janv. 2000
15.263
-11.486
-42.94%
1 janv. 2001
14.523
-0.74
-4.85%
1 janv. 2002
18.666
+4.143
28.53%
1 janv. 2003
24.401
+5.735
30.73%
1 janv. 2004
40.891
+16.49
67.58%
1 janv. 2005
30.863
-10.028
-24.52%
1 janv. 2006
26.324
-4.539
-14.71%
1 janv. 2007
23.494
-2.83
-10.75%
1 janv. 2008
31.665
+8.172
34.78%
1 janv. 2009
32.33
+0.665
2.1%
1 janv. 2010
30.518
-1.812
-5.6%
1 janv. 2011
23.397
-7.121
-23.33%
1 janv. 2012
22.913
-0.484
-2.07%
1 janv. 2013
15.677
-7.236
-31.58%
1 janv. 2014
15.19
-0.487
-3.11%
1 janv. 2015
13.507
-1.683
-11.08%
Classement des pays selon les statistiques actuelles par années


Commentaires: