29
/fr/
fr
AIzaSyAYiBZKx7MnpbEhh9jyipgxe19OcubqV5w
April 1, 2024
56012
Small states
SST
false
2
1
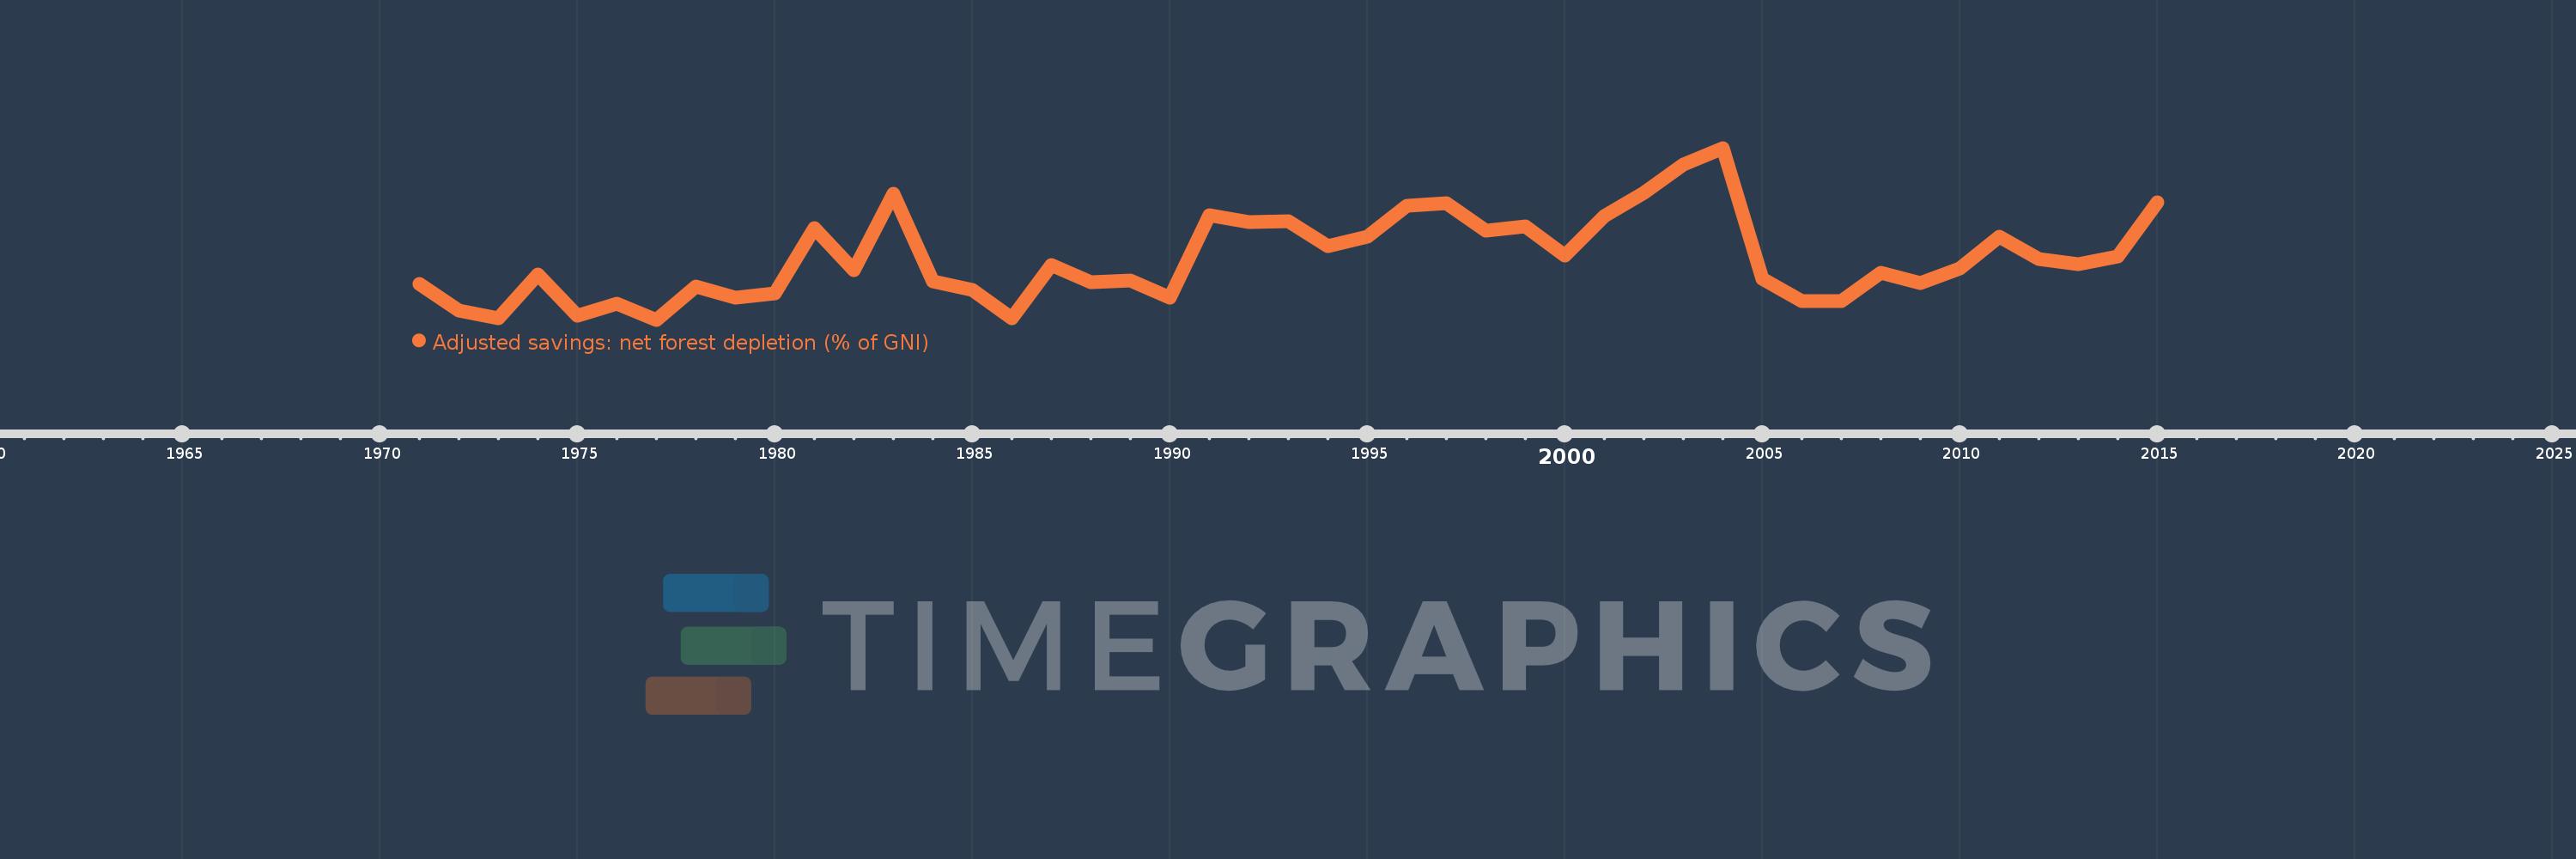
Adjusted savings: net forest depletion (% of GNI)
2015,2014,2013,2012,2011,2010,2009,2008,2007,2006,2005,2004,2003,2002,2001,2000,1999,1998,1997,1996,1995,1994,1993,1992,1991,1990,1989,1988,1987,1986,1985,1984,1983,1982,1981,1980,1979,1978,1977,1976,1975,1974,1973,1972,1971
Cette statistique dans les autres pays:
AfghanistanAlbaniaAlgeriaAngolaArab WorldArgentinaArmeniaAustraliaAustriaAzerbaijanBahamas, TheBahrainBangladeshBarbadosBelarusBelgiumBelizeBeninBhutanBoliviaBotswanaBrazilBrunei DarussalamBulgariaBurkina FasoBurundiCabo VerdeCambodiaCameroonCanadaCaribbean small statesCentral African RepublicCentral Europe and the BalticsChadChileChinaColombiaComorosCongo, Dem. Rep.Congo, Rep.Costa RicaCote d'IvoireCroatiaCubaCyprusCzech RepublicDenmarkDjiboutiDominicaDominican RepublicEarly-demographic dividendEast Asia & PacificEast Asia & Pacific (excluding high income)East Asia & Pacific (IDA & IBRD countries)EcuadorEgypt, Arab Rep.El SalvadorEquatorial GuineaEritreaEstoniaEthiopiaEuro areaEurope & Central AsiaEurope & Central Asia (excluding high income)Europe & Central Asia (IDA & IBRD countries)European UnionFijiFinlandFragile and conflict affected situationsFranceFrench PolynesiaGabonGambia, TheGeorgiaGermanyGhanaGreeceGuatemalaGuineaGuinea-BissauGuyanaHaitiHeavily indebted poor countries (HIPC)High incomeHondurasHong Kong SAR, ChinaHungaryIBRD onlyIcelandIDA & IBRD totalIDA blendIDA onlyIDA totalIndiaIndonesiaIran, Islamic Rep.IraqIrelandIsraelItalyJamaicaJapanJordanKazakhstanKenyaKiribatiKorea, Rep.KuwaitKyrgyz RepublicLao PDRLate-demographic dividendLatin America & Caribbean Latin America & Caribbean (excluding high income)Latin America & the Caribbean (IDA & IBRD countries)LatviaLeast developed countries: UN classificationLebanonLesothoLiberiaLibyaLithuaniaLow & middle incomeLow incomeLower middle incomeLuxembourgMacedonia, FYRMadagascarMalawiMalaysiaMaldivesMaliMauritaniaMauritiusMexicoMicronesia, Fed. Sts.Middle East & North AfricaMiddle East & North Africa (excluding high income)Middle East & North Africa (IDA & IBRD countries)Middle incomeMoldovaMongoliaMoroccoMozambiqueMyanmarNamibiaNepalNetherlandsNew CaledoniaNew ZealandNicaraguaNigerNigeriaNorth AmericaNorwayOECD membersOmanOther small statesPacific island small statesPakistanPanamaPapua New GuineaParaguayPeruPhilippinesPolandPortugalPost-demographic dividendPre-demographic dividendQatarRomaniaRussian FederationRwandaSamoaSao Tome and PrincipeSaudi ArabiaSenegalSeychellesSierra LeoneSingaporeSlovak RepublicSloveniaSmall statesSolomon IslandsSomaliaSouth AfricaSouth AsiaSouth Asia (IDA & IBRD)SpainSri LankaSt. LuciaSt. Vincent and the GrenadinesSub-Saharan Africa Sub-Saharan Africa (excluding high income)Sub-Saharan Africa (IDA & IBRD countries)SudanSurinameSwazilandSwedenSwitzerlandSyrian Arab RepublicTajikistanTanzaniaThailandTogoTongaTrinidad and TobagoTunisiaTurkeyTurkmenistanUgandaUkraineUnited Arab EmiratesUnited KingdomUnited StatesUpper middle incomeUruguayUzbekistanVanuatuVenezuela, RBVietnamWorldYemen, Rep.ZambiaZimbabwe La ligne de temps
Cette échelle de temps montre un graphique de 1971 année à 2015 année Small states. Les données jusqu'à 1970 année ne sont pas présentés. Quantité d'observations actuelles selon dates: 45.
Source (désignation):
Les indicateurs du développement mondiale
Source (organisation):
World Bank staff estimates based on sources and methods in World Bank's "The Changing Wealth of Nations: Measuring Sustainable Development in the New Millennium" (2011).
Catégories:
Economy & Growth, Environment
Dernière mise à jour
23 avr. 2017
Les indicateurs de changement de valeurs selon les années
Minimum:
0.135
1 janv. 1977
Maximum:
0.419
1 janv. 2004
Pour la date d''observation
Valeur
Changement absolu
Le changement par rapport à la valeur précédente
1 janv. 1971
0.194
+0.194
0.0%
1 janv. 1972
0.15
-0.044
-22.72%
1 janv. 1973
0.137
-0.013
-8.55%
1 janv. 1974
0.21
+0.072
52.76%
1 janv. 1975
0.141
-0.069
-32.84%
1 janv. 1976
0.161
+0.02
14.31%
1 janv. 1977
0.135
-0.026
-15.91%
1 janv. 1978
0.19
+0.055
40.29%
1 janv. 1979
0.172
-0.018
-9.42%
1 janv. 1980
0.179
+0.007
3.93%
1 janv. 1981
0.286
+0.108
60.17%
1 janv. 1982
0.217
-0.069
-24.06%
1 janv. 1983
0.343
+0.126
57.84%
1 janv. 1984
0.199
-0.144
-42.08%
1 janv. 1985
0.184
-0.015
-7.35%
1 janv. 1986
0.138
-0.046
-24.82%
1 janv. 1987
0.226
+0.087
63.15%
1 janv. 1988
0.197
-0.029
-12.76%
1 janv. 1989
0.2
+0.003
1.64%
1 janv. 1990
0.171
-0.029
-14.43%
1 janv. 1991
0.308
+0.136
79.6%
1 janv. 1992
0.296
-0.012
-3.87%
1 janv. 1993
0.298
+0.002
0.75%
1 janv. 1994
0.257
-0.042
-13.98%
1 janv. 1995
0.273
+0.017
6.55%
1 janv. 1996
0.324
+0.05
18.39%
1 janv. 1997
0.328
+0.004
1.28%
1 janv. 1998
0.282
-0.046
-14.06%
1 janv. 1999
0.29
+0.008
2.8%
1 janv. 2000
0.241
-0.049
-16.85%
1 janv. 2001
0.307
+0.066
27.55%
1 janv. 2002
0.345
+0.038
12.21%
1 janv. 2003
0.392
+0.048
13.8%
1 janv. 2004
0.419
+0.027
6.79%
1 janv. 2005
0.203
-0.216
-51.53%
1 janv. 2006
0.166
-0.037
-18.02%
1 janv. 2007
0.166
-0.001
-0.53%
1 janv. 2008
0.213
+0.047
28.4%
1 janv. 2009
0.195
-0.018
-8.27%
1 janv. 2010
0.22
+0.025
12.77%
1 janv. 2011
0.273
+0.053
24.03%
1 janv. 2012
0.235
-0.038
-13.88%
1 janv. 2013
0.227
-0.008
-3.33%
1 janv. 2014
0.24
+0.013
5.78%
1 janv. 2015
0.329
+0.089
37.16%
Classement des pays selon les statistiques actuelles par années


Commentaires: