29
/fr/
fr
AIzaSyAYiBZKx7MnpbEhh9jyipgxe19OcubqV5w
April 1, 2024
53192
Other small states
OSS
false
2
1
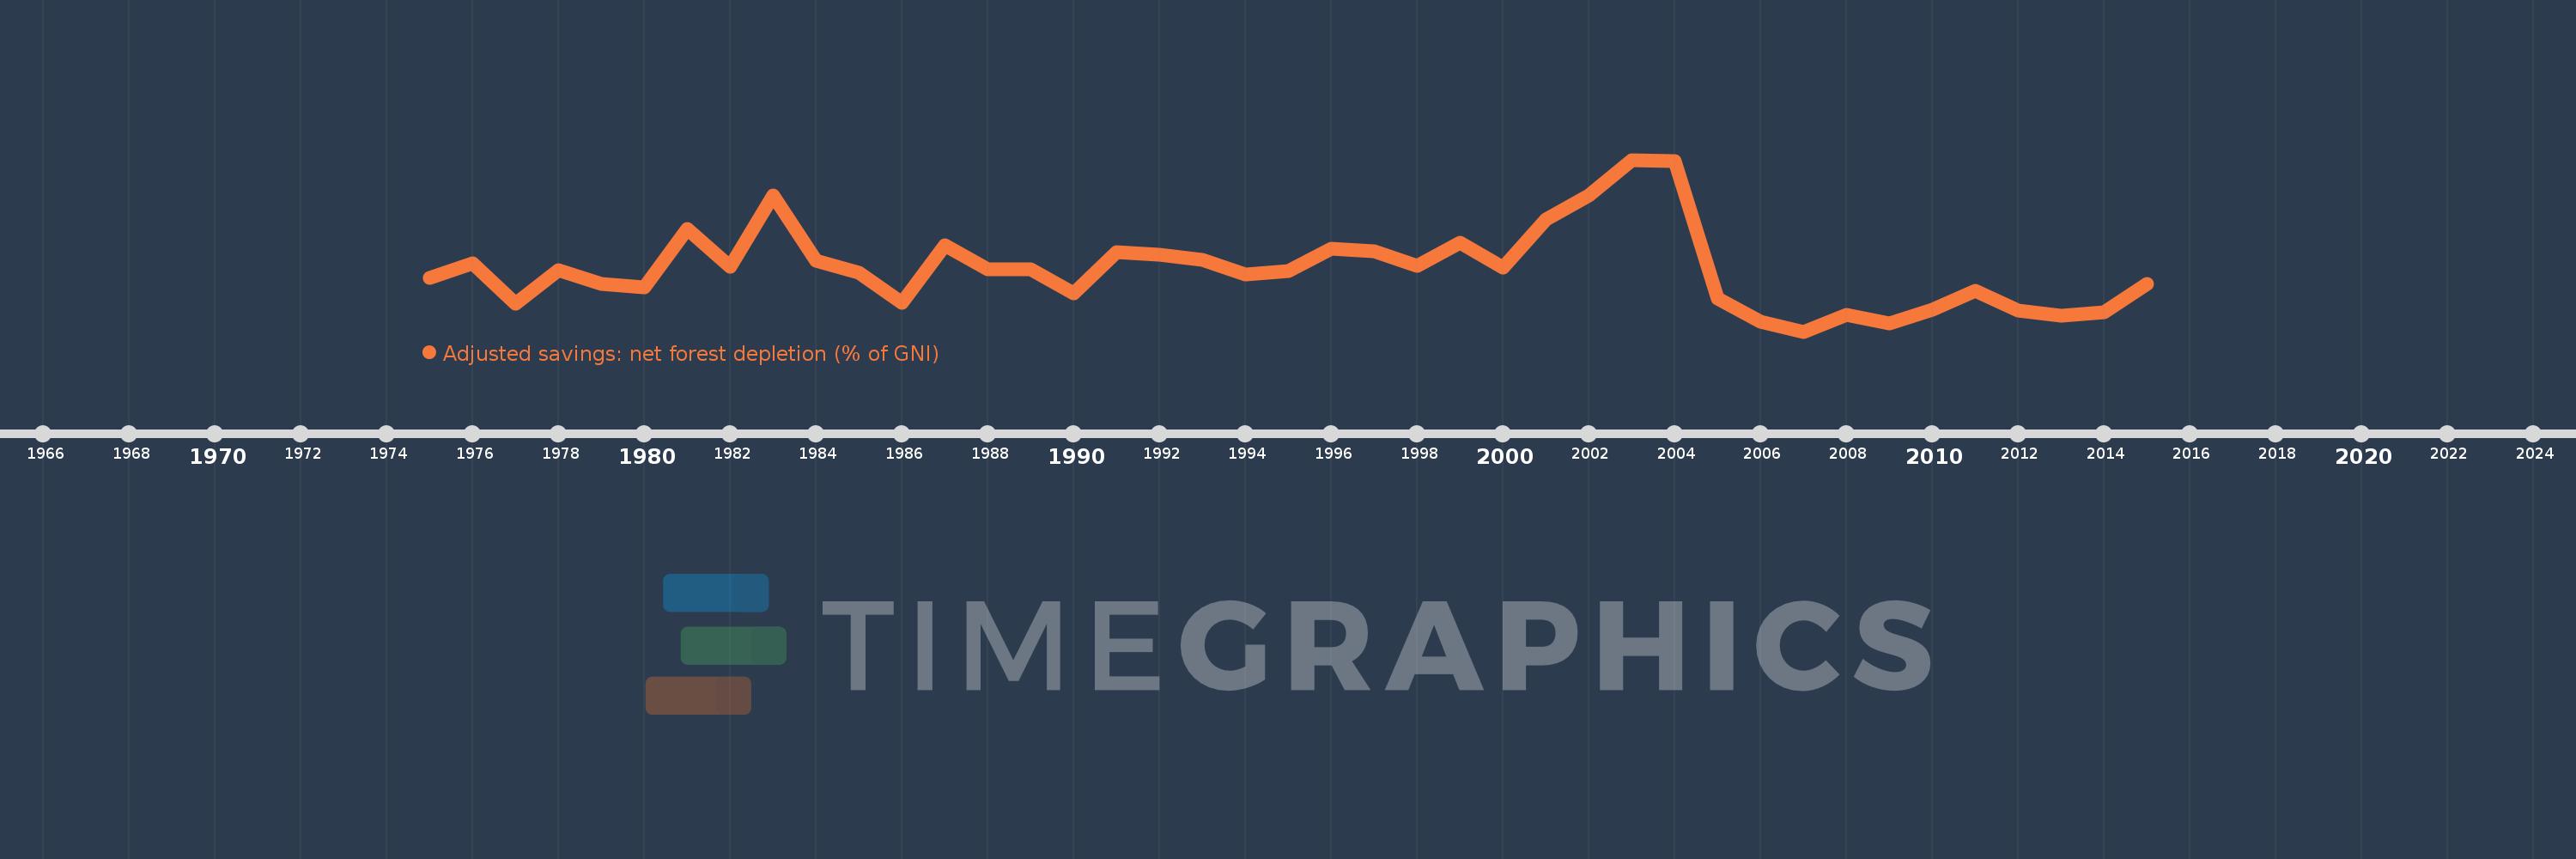
Adjusted savings: net forest depletion (% of GNI)
2015,2014,2013,2012,2011,2010,2009,2008,2007,2006,2005,2004,2003,2002,2001,2000,1999,1998,1997,1996,1995,1994,1993,1992,1991,1990,1989,1988,1987,1986,1985,1984,1983,1982,1981,1980,1979,1978,1977,1976,1975
Cette statistique dans les autres pays:
AfghanistanAlbaniaAlgeriaAngolaArab WorldArgentinaArmeniaAustraliaAustriaAzerbaijanBahamas, TheBahrainBangladeshBarbadosBelarusBelgiumBelizeBeninBhutanBoliviaBotswanaBrazilBrunei DarussalamBulgariaBurkina FasoBurundiCabo VerdeCambodiaCameroonCanadaCaribbean small statesCentral African RepublicCentral Europe and the BalticsChadChileChinaColombiaComorosCongo, Dem. Rep.Congo, Rep.Costa RicaCote d'IvoireCroatiaCubaCyprusCzech RepublicDenmarkDjiboutiDominicaDominican RepublicEarly-demographic dividendEast Asia & PacificEast Asia & Pacific (excluding high income)East Asia & Pacific (IDA & IBRD countries)EcuadorEgypt, Arab Rep.El SalvadorEquatorial GuineaEritreaEstoniaEthiopiaEuro areaEurope & Central AsiaEurope & Central Asia (excluding high income)Europe & Central Asia (IDA & IBRD countries)European UnionFijiFinlandFragile and conflict affected situationsFranceFrench PolynesiaGabonGambia, TheGeorgiaGermanyGhanaGreeceGuatemalaGuineaGuinea-BissauGuyanaHaitiHeavily indebted poor countries (HIPC)High incomeHondurasHong Kong SAR, ChinaHungaryIBRD onlyIcelandIDA & IBRD totalIDA blendIDA onlyIDA totalIndiaIndonesiaIran, Islamic Rep.IraqIrelandIsraelItalyJamaicaJapanJordanKazakhstanKenyaKiribatiKorea, Rep.KuwaitKyrgyz RepublicLao PDRLate-demographic dividendLatin America & Caribbean Latin America & Caribbean (excluding high income)Latin America & the Caribbean (IDA & IBRD countries)LatviaLeast developed countries: UN classificationLebanonLesothoLiberiaLibyaLithuaniaLow & middle incomeLow incomeLower middle incomeLuxembourgMacedonia, FYRMadagascarMalawiMalaysiaMaldivesMaliMauritaniaMauritiusMexicoMicronesia, Fed. Sts.Middle East & North AfricaMiddle East & North Africa (excluding high income)Middle East & North Africa (IDA & IBRD countries)Middle incomeMoldovaMongoliaMoroccoMozambiqueMyanmarNamibiaNepalNetherlandsNew CaledoniaNew ZealandNicaraguaNigerNigeriaNorth AmericaNorwayOECD membersOmanOther small statesPacific island small statesPakistanPanamaPapua New GuineaParaguayPeruPhilippinesPolandPortugalPost-demographic dividendPre-demographic dividendQatarRomaniaRussian FederationRwandaSamoaSao Tome and PrincipeSaudi ArabiaSenegalSeychellesSierra LeoneSingaporeSlovak RepublicSloveniaSmall statesSolomon IslandsSomaliaSouth AfricaSouth AsiaSouth Asia (IDA & IBRD)SpainSri LankaSt. LuciaSt. Vincent and the GrenadinesSub-Saharan Africa Sub-Saharan Africa (excluding high income)Sub-Saharan Africa (IDA & IBRD countries)SudanSurinameSwazilandSwedenSwitzerlandSyrian Arab RepublicTajikistanTanzaniaThailandTogoTongaTrinidad and TobagoTunisiaTurkeyTurkmenistanUgandaUkraineUnited Arab EmiratesUnited KingdomUnited StatesUpper middle incomeUruguayUzbekistanVanuatuVenezuela, RBVietnamWorldYemen, Rep.ZambiaZimbabwe La ligne de temps
Cette échelle de temps montre un graphique de 1975 année à 2015 année Other small states. Les données jusqu'à 1974 année ne sont pas présentés. Quantité d'observations actuelles selon dates: 41.
Source (désignation):
Les indicateurs du développement mondiale
Source (organisation):
World Bank staff estimates based on sources and methods in World Bank's "The Changing Wealth of Nations: Measuring Sustainable Development in the New Millennium" (2011).
Catégories:
Economy & Growth, Environment
Dernière mise à jour
23 avr. 2017
Les indicateurs de changement de valeurs selon les années
Maximum:
0.568
1 janv. 2003
Pour la date d''observation
Valeur
Changement absolu
Le changement par rapport à la valeur précédente
1 janv. 1975
0.281
+0.281
0.0%
1 janv. 1976
0.317
+0.036
12.67%
1 janv. 1977
0.217
-0.1
-31.43%
1 janv. 1978
0.299
+0.082
37.65%
1 janv. 1979
0.265
-0.034
-11.45%
1 janv. 1980
0.258
-0.007
-2.53%
1 janv. 1981
0.399
+0.141
54.73%
1 janv. 1982
0.307
-0.092
-23.13%
1 janv. 1983
0.482
+0.175
57.04%
1 janv. 1984
0.323
-0.159
-33.01%
1 janv. 1985
0.293
-0.03
-9.33%
1 janv. 1986
0.221
-0.072
-24.61%
1 janv. 1987
0.36
+0.139
63.04%
1 janv. 1988
0.301
-0.059
-16.33%
1 janv. 1989
0.301
+0.0
0.05%
1 janv. 1990
0.244
-0.058
-19.12%
1 janv. 1991
0.343
+0.1
40.93%
1 janv. 1992
0.338
-0.006
-1.62%
1 janv. 1993
0.324
-0.014
-4.11%
1 janv. 1994
0.29
-0.034
-10.39%
1 janv. 1995
0.298
+0.008
2.7%
1 janv. 1996
0.352
+0.054
18.16%
1 janv. 1997
0.345
-0.007
-2.0%
1 janv. 1998
0.309
-0.036
-10.49%
1 janv. 1999
0.366
+0.057
18.53%
1 janv. 2000
0.305
-0.061
-16.7%
1 janv. 2001
0.423
+0.118
38.8%
1 janv. 2002
0.482
+0.058
13.7%
1 janv. 2003
0.568
+0.086
17.86%
1 janv. 2004
0.565
-0.003
-0.51%
1 janv. 2005
0.23
-0.335
-59.25%
1 janv. 2006
0.173
-0.058
-25.0%
1 janv. 2007
0.15
-0.022
-12.95%
1 janv. 2008
0.191
+0.041
26.99%
1 janv. 2009
0.169
-0.022
-11.64%
1 janv. 2010
0.203
+0.034
20.28%
1 janv. 2011
0.249
+0.047
23.0%
1 janv. 2012
0.202
-0.048
-19.13%
1 janv. 2013
0.189
-0.012
-6.04%
1 janv. 2014
0.197
+0.007
3.75%
1 janv. 2015
0.267
+0.071
36.06%
Classement des pays selon les statistiques actuelles par années


Commentaires: