29
/fr/
fr
AIzaSyAYiBZKx7MnpbEhh9jyipgxe19OcubqV5w
April 1, 2024
92635
Brunei Darussalam
BRN
true
2
1
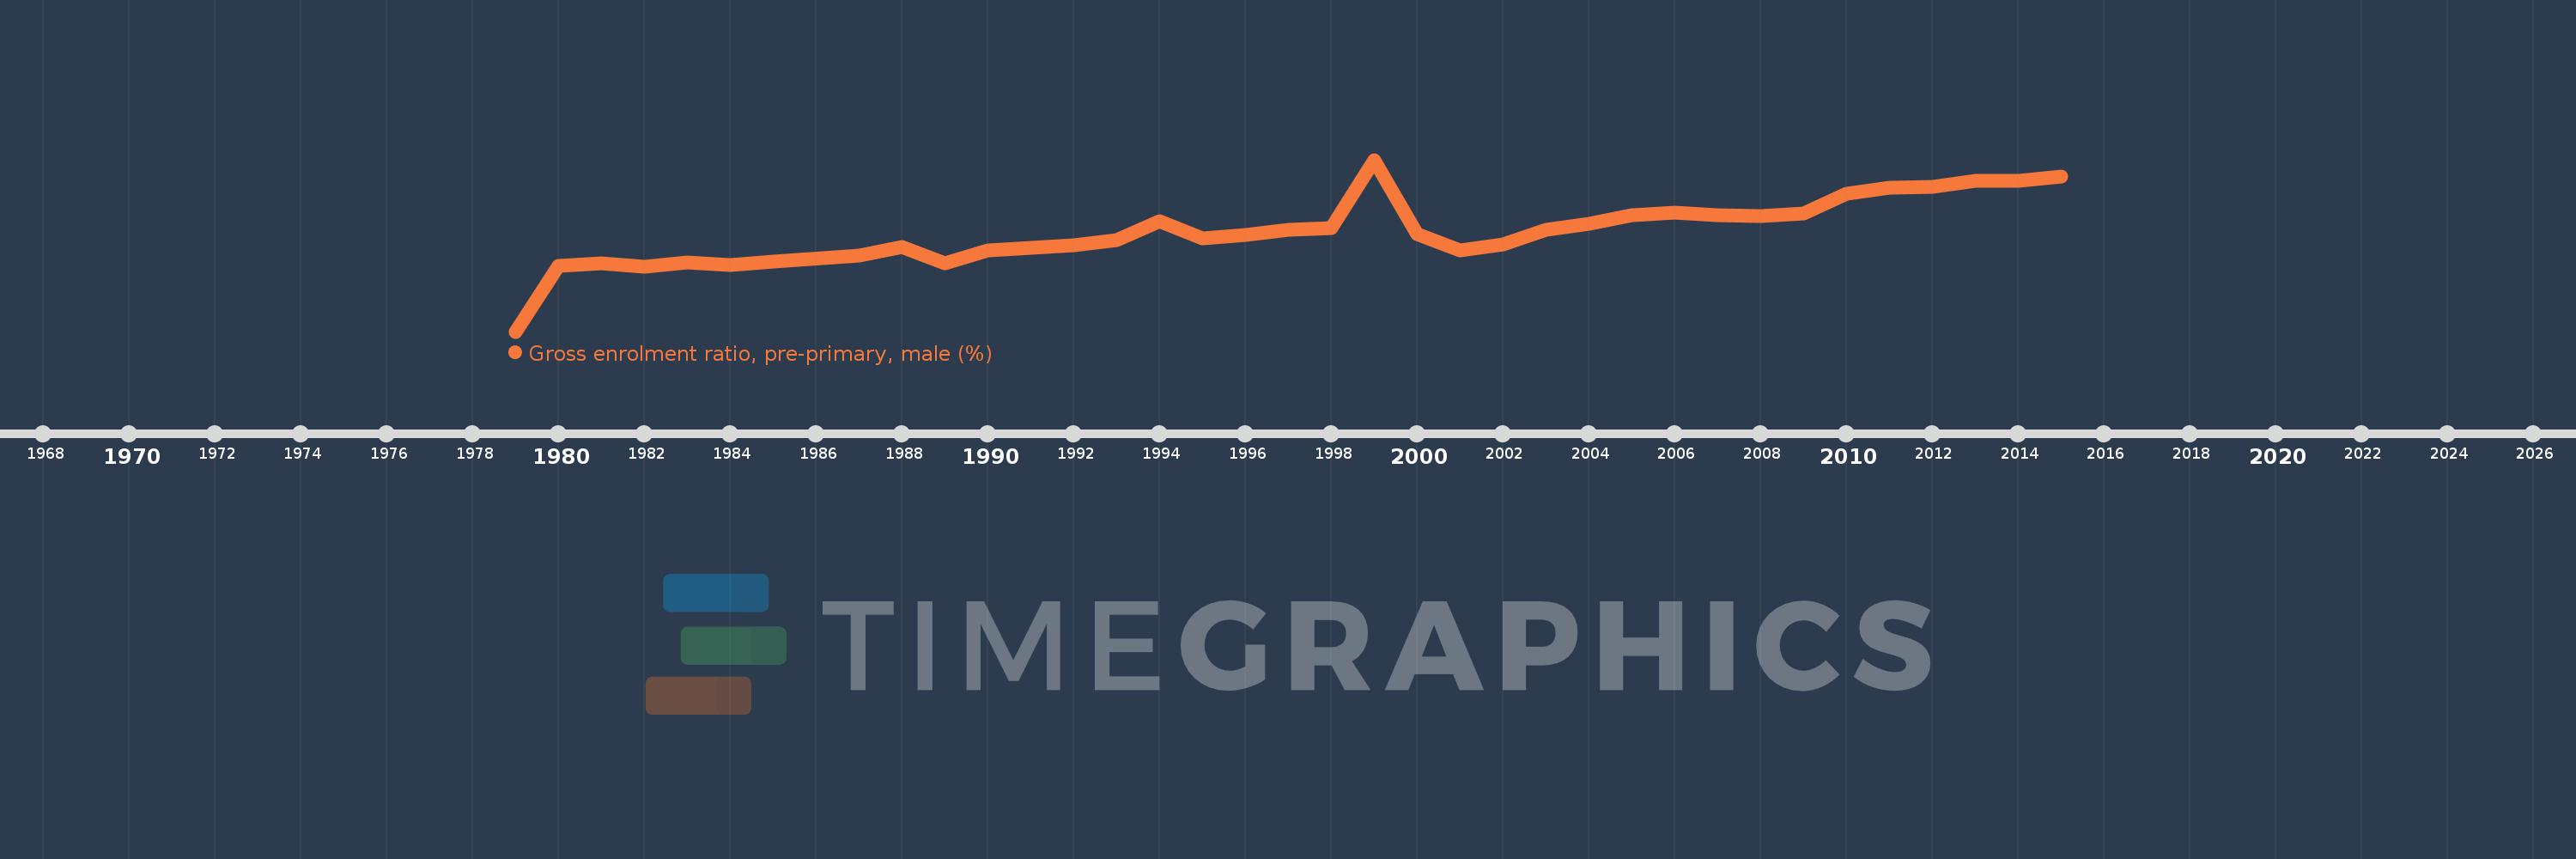
Gross enrolment ratio, pre-primary, male (%)
2015,2014,2013,2012,2011,2010,2009,2008,2007,2006,2005,2004,2003,2002,2001,2000,1999,1998,1997,1996,1995,1994,1993,1992,1990,1989,1988,1987,1985,1984,1983,1982,1981,1980,1979
Cette statistique dans les autres pays:
AfghanistanAlbaniaAlgeriaAndorraAngolaAntigua and BarbudaArab WorldArgentinaArmeniaArubaAustraliaAustriaAzerbaijanBahamas, TheBahrainBangladeshBarbadosBelarusBelgiumBelizeBeninBermudaBhutanBoliviaBosnia and HerzegovinaBotswanaBrazilBrunei DarussalamBulgariaBurkina FasoBurundiCabo VerdeCambodiaCameroonCanadaCaribbean small statesCentral African RepublicCentral Europe and the BalticsChadChileChinaColombiaComorosCongo, Dem. Rep.Congo, Rep.Costa RicaCote d'IvoireCroatiaCubaCyprusCzech RepublicDenmarkDjiboutiDominicaDominican RepublicEarly-demographic dividendEast Asia & PacificEast Asia & Pacific (excluding high income)East Asia & Pacific (IDA & IBRD countries)EcuadorEgypt, Arab Rep.El SalvadorEquatorial GuineaEritreaEstoniaEthiopiaEuro areaEurope & Central AsiaEurope & Central Asia (excluding high income)Europe & Central Asia (IDA & IBRD countries)European UnionFijiFinlandFragile and conflict affected situationsFranceGabonGambia, TheGeorgiaGermanyGhanaGreeceGrenadaGuatemalaGuineaGuinea-BissauGuyanaHeavily indebted poor countries (HIPC)High incomeHondurasHong Kong SAR, ChinaHungaryIBRD onlyIcelandIDA & IBRD totalIDA blendIDA onlyIDA totalIndiaIndonesiaIran, Islamic Rep.IraqIrelandIsraelItalyJamaicaJapanJordanKazakhstanKenyaKorea, Dem. People’s Rep.Korea, Rep.KuwaitKyrgyz RepublicLao PDRLate-demographic dividendLatin America & Caribbean Latin America & Caribbean (excluding high income)Latin America & the Caribbean (IDA & IBRD countries)LatviaLeast developed countries: UN classificationLebanonLesothoLiberiaLibyaLiechtensteinLithuaniaLow & middle incomeLow incomeLower middle incomeLuxembourgMacao SAR, ChinaMacedonia, FYRMadagascarMaldivesMaliMaltaMarshall IslandsMauritaniaMauritiusMexicoMicronesia, Fed. Sts.Middle East & North AfricaMiddle East & North Africa (excluding high income)Middle East & North Africa (IDA & IBRD countries)Middle incomeMoldovaMongoliaMontenegroMoroccoMozambiqueMyanmarNamibiaNauruNepalNetherlandsNew ZealandNicaraguaNigerNigeriaNorth AmericaNorwayOECD membersOmanOther small statesPacific island small statesPakistanPalauPanamaPapua New GuineaParaguayPeruPhilippinesPolandPortugalPost-demographic dividendPre-demographic dividendPuerto RicoQatarRomaniaRussian FederationRwandaSamoaSan MarinoSao Tome and PrincipeSaudi ArabiaSenegalSerbiaSeychellesSierra LeoneSlovak RepublicSloveniaSmall statesSolomon IslandsSomaliaSouth AfricaSouth AsiaSouth Asia (IDA & IBRD)South SudanSpainSri LankaSt. Kitts and NevisSt. LuciaSt. Vincent and the GrenadinesSub-Saharan Africa Sub-Saharan Africa (excluding high income)Sub-Saharan Africa (IDA & IBRD countries)SudanSurinameSwazilandSwedenSwitzerlandSyrian Arab RepublicTajikistanTanzaniaThailandTimor-LesteTogoTongaTrinidad and TobagoTunisiaTurkeyTurkmenistanTuvaluUgandaUkraineUnited Arab EmiratesUnited KingdomUnited StatesUpper middle incomeUruguayUzbekistanVanuatuVenezuela, RBVietnamWest Bank and GazaWorldYemen, Rep.Zimbabwe La ligne de temps
Cette échelle de temps montre un graphique de 1979 année à 2015 année Brunei Darussalam. Les données jusqu'à 1978 année ne sont pas présentés. Quantité d'observations actuelles selon dates: 35.
Source (désignation):
Les indicateurs du développement mondiale
Source (organisation):
UNESCO Institute for Statistics
Catégories:
Education, Gender
Dernière mise à jour
23 avr. 2017
Les indicateurs de changement de valeurs selon les années
Minimum:
17.456
1 janv. 1979
Maximum:
78.84
1 janv. 1999
Pour la date d''observation
Valeur
Changement absolu
Le changement par rapport à la valeur précédente
1 janv. 1979
17.456
+17.456
0.0%
1 janv. 1980
40.806
+23.35
133.76%
1 janv. 1981
42.009
+1.203
2.95%
1 janv. 1982
40.72
-1.289
-3.07%
1 janv. 1983
42.097
+1.377
3.38%
1 janv. 1984
41.25
-0.847
-2.01%
1 janv. 1985
42.421
+1.171
2.84%
1 janv. 1987
44.659
+2.238
5.28%
1 janv. 1988
47.665
+3.006
6.73%
1 janv. 1989
41.907
-5.758
-12.08%
1 janv. 1990
46.514
+4.607
10.99%
1 janv. 1992
48.375
+1.861
4.0%
1 janv. 1993
50.13
+1.755
3.63%
1 janv. 1994
57.013
+6.883
13.73%
1 janv. 1995
50.844
-6.169
-10.82%
1 janv. 1996
51.897
+1.054
2.07%
1 janv. 1997
53.838
+1.941
3.74%
1 janv. 1998
54.491
+0.653
1.21%
1 janv. 1999
78.84
+24.349
44.68%
1 janv. 2000
52.316
-26.524
-33.64%
1 janv. 2001
46.599
-5.717
-10.93%
1 janv. 2002
48.474
+1.875
4.02%
1 janv. 2003
53.846
+5.372
11.08%
1 janv. 2004
56.085
+2.239
4.16%
1 janv. 2005
59.15
+3.065
5.47%
1 janv. 2006
59.928
+0.778
1.32%
1 janv. 2007
58.931
-0.997
-1.66%
1 janv. 2008
58.646
-0.285
-0.48%
1 janv. 2009
59.56
+0.914
1.56%
1 janv. 2010
66.852
+7.291
12.24%
1 janv. 2011
68.834
+1.983
2.97%
1 janv. 2012
69.121
+0.286
0.42%
1 janv. 2013
71.43
+2.309
3.34%
1 janv. 2014
71.21
-0.22
-0.31%
1 janv. 2015
72.948
+1.738
2.44%
Classement des pays selon les statistiques actuelles par années


Commentaires: