29
/fr/
fr
AIzaSyAYiBZKx7MnpbEhh9jyipgxe19OcubqV5w
April 1, 2024
113641
Cote d'Ivoire
CIV
true
2
1
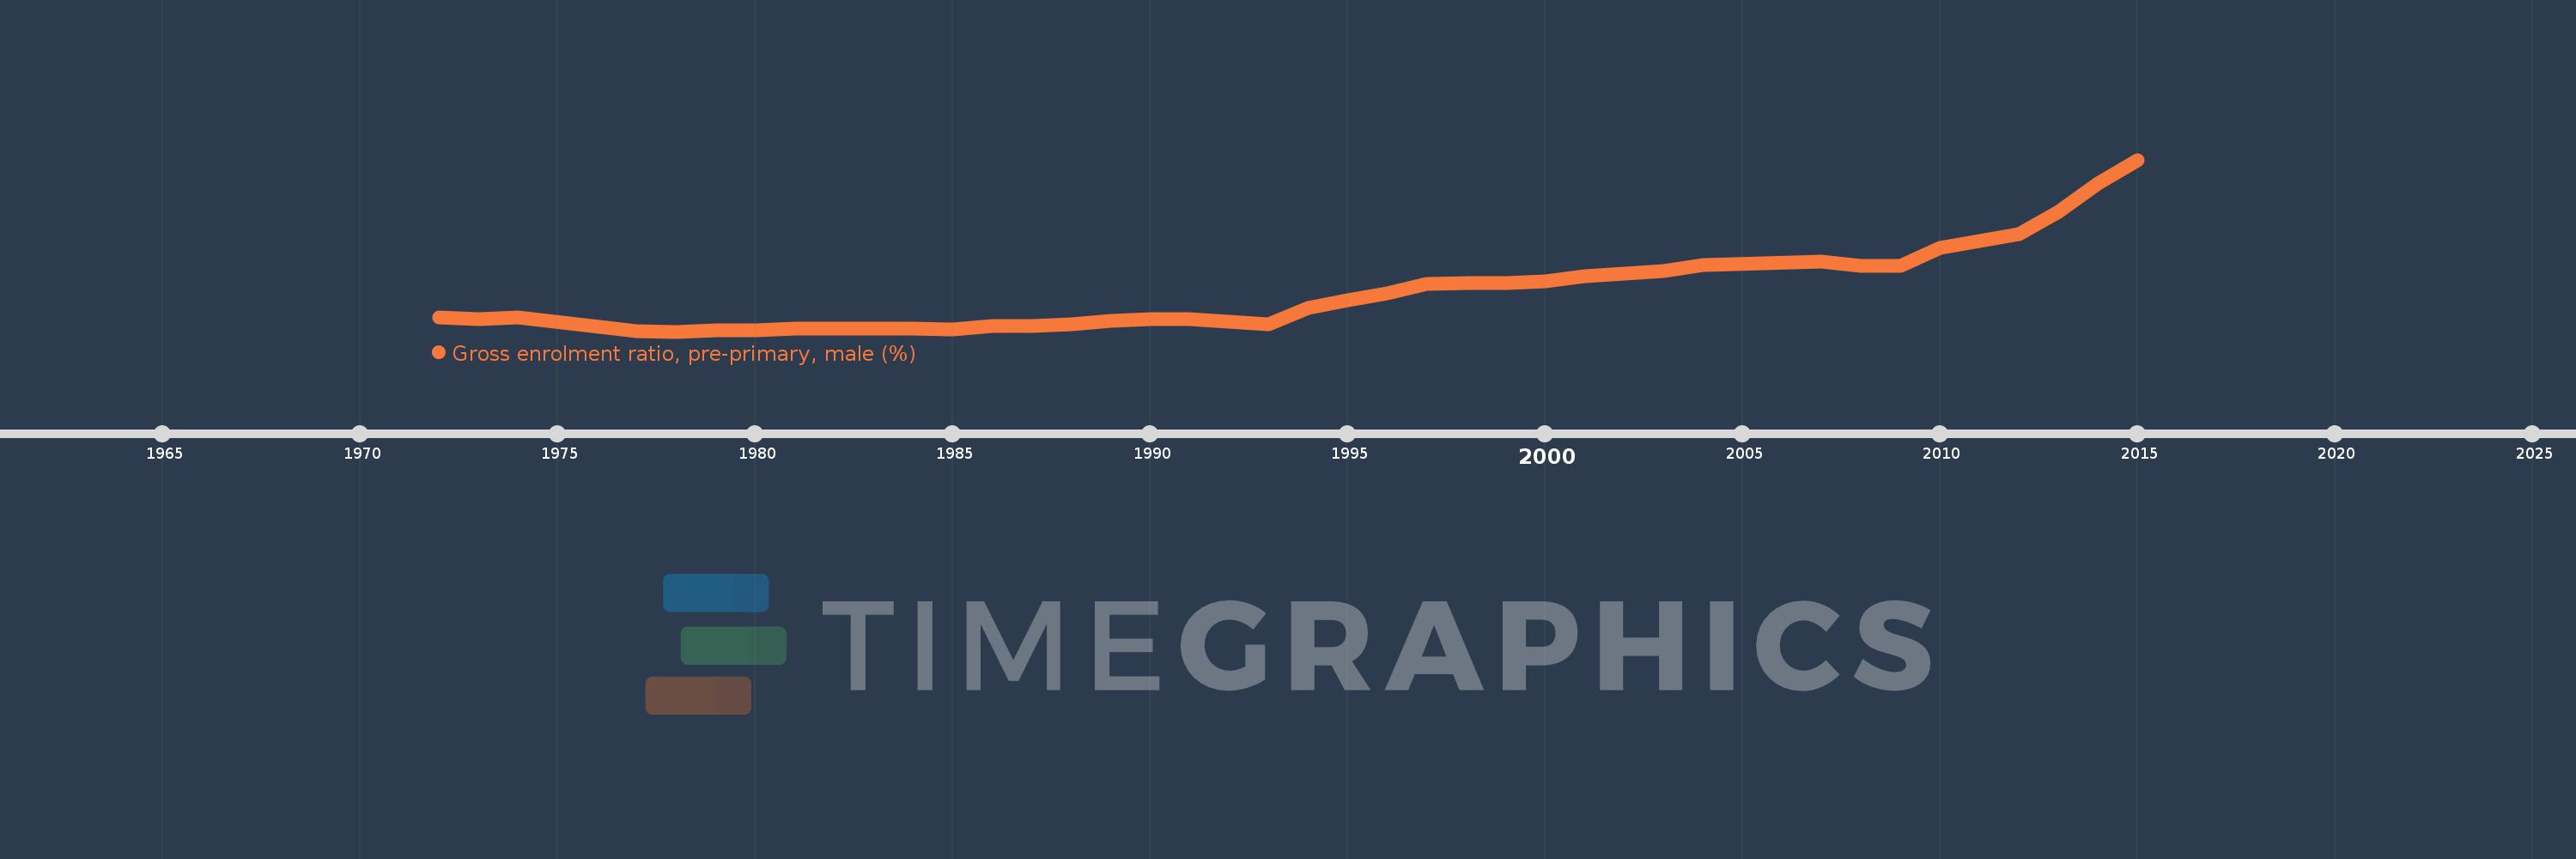
Gross enrolment ratio, pre-primary, male (%)
2015,2014,2013,2012,2010,2009,2008,2007,2004,2003,2002,2001,2000,1999,1998,1997,1996,1995,1994,1993,1992,1991,1990,1989,1988,1987,1986,1985,1984,1983,1982,1981,1980,1979,1978,1977,1974,1973,1972
Cette statistique dans les autres pays:
AfghanistanAlbaniaAlgeriaAndorraAngolaAntigua and BarbudaArab WorldArgentinaArmeniaArubaAustraliaAustriaAzerbaijanBahamas, TheBahrainBangladeshBarbadosBelarusBelgiumBelizeBeninBermudaBhutanBoliviaBosnia and HerzegovinaBotswanaBrazilBrunei DarussalamBulgariaBurkina FasoBurundiCabo VerdeCambodiaCameroonCanadaCaribbean small statesCentral African RepublicCentral Europe and the BalticsChadChileChinaColombiaComorosCongo, Dem. Rep.Congo, Rep.Costa RicaCote d'IvoireCroatiaCubaCyprusCzech RepublicDenmarkDjiboutiDominicaDominican RepublicEarly-demographic dividendEast Asia & PacificEast Asia & Pacific (excluding high income)East Asia & Pacific (IDA & IBRD countries)EcuadorEgypt, Arab Rep.El SalvadorEquatorial GuineaEritreaEstoniaEthiopiaEuro areaEurope & Central AsiaEurope & Central Asia (excluding high income)Europe & Central Asia (IDA & IBRD countries)European UnionFijiFinlandFragile and conflict affected situationsFranceGabonGambia, TheGeorgiaGermanyGhanaGreeceGrenadaGuatemalaGuineaGuinea-BissauGuyanaHeavily indebted poor countries (HIPC)High incomeHondurasHong Kong SAR, ChinaHungaryIBRD onlyIcelandIDA & IBRD totalIDA blendIDA onlyIDA totalIndiaIndonesiaIran, Islamic Rep.IraqIrelandIsraelItalyJamaicaJapanJordanKazakhstanKenyaKorea, Dem. People’s Rep.Korea, Rep.KuwaitKyrgyz RepublicLao PDRLate-demographic dividendLatin America & Caribbean Latin America & Caribbean (excluding high income)Latin America & the Caribbean (IDA & IBRD countries)LatviaLeast developed countries: UN classificationLebanonLesothoLiberiaLibyaLiechtensteinLithuaniaLow & middle incomeLow incomeLower middle incomeLuxembourgMacao SAR, ChinaMacedonia, FYRMadagascarMaldivesMaliMaltaMarshall IslandsMauritaniaMauritiusMexicoMicronesia, Fed. Sts.Middle East & North AfricaMiddle East & North Africa (excluding high income)Middle East & North Africa (IDA & IBRD countries)Middle incomeMoldovaMongoliaMontenegroMoroccoMozambiqueMyanmarNamibiaNauruNepalNetherlandsNew ZealandNicaraguaNigerNigeriaNorth AmericaNorwayOECD membersOmanOther small statesPacific island small statesPakistanPalauPanamaPapua New GuineaParaguayPeruPhilippinesPolandPortugalPost-demographic dividendPre-demographic dividendPuerto RicoQatarRomaniaRussian FederationRwandaSamoaSan MarinoSao Tome and PrincipeSaudi ArabiaSenegalSerbiaSeychellesSierra LeoneSlovak RepublicSloveniaSmall statesSolomon IslandsSomaliaSouth AfricaSouth AsiaSouth Asia (IDA & IBRD)South SudanSpainSri LankaSt. Kitts and NevisSt. LuciaSt. Vincent and the GrenadinesSub-Saharan Africa Sub-Saharan Africa (excluding high income)Sub-Saharan Africa (IDA & IBRD countries)SudanSurinameSwazilandSwedenSwitzerlandSyrian Arab RepublicTajikistanTanzaniaThailandTimor-LesteTogoTongaTrinidad and TobagoTunisiaTurkeyTurkmenistanTuvaluUgandaUkraineUnited Arab EmiratesUnited KingdomUnited StatesUpper middle incomeUruguayUzbekistanVanuatuVenezuela, RBVietnamWest Bank and GazaWorldYemen, Rep.Zimbabwe La ligne de temps
Cette échelle de temps montre un graphique de 1972 année à 2015 année Cote d'Ivoire. Les données jusqu'à 1971 année ne sont pas présentés. Quantité d'observations actuelles selon dates: 39.
Source (désignation):
Les indicateurs du développement mondiale
Source (organisation):
UNESCO Institute for Statistics
Catégories:
Education, Gender
Dernière mise à jour
23 avr. 2017
Les indicateurs de changement de valeurs selon les années
Minimum:
0.678
1 janv. 1978
Maximum:
6.551
1 janv. 2015
Pour la date d''observation
Valeur
Changement absolu
Le changement par rapport à la valeur précédente
1 janv. 1972
1.148
+1.148
0.0%
1 janv. 1973
1.092
-0.056
-4.91%
1 janv. 1974
1.165
+0.073
6.69%
1 janv. 1977
0.699
-0.466
-39.97%
1 janv. 1978
0.678
-0.021
-3.07%
1 janv. 1979
0.722
+0.044
6.54%
1 janv. 1980
0.727
+0.005
0.7%
1 janv. 1981
0.775
+0.047
6.51%
1 janv. 1982
0.776
+0.001
0.14%
1 janv. 1983
0.785
+0.009
1.22%
1 janv. 1984
0.77
-0.015
-1.9%
1 janv. 1985
0.765
-0.005
-0.7%
1 janv. 1986
0.877
+0.112
14.7%
1 janv. 1987
0.856
-0.021
-2.41%
1 janv. 1988
0.921
+0.065
7.6%
1 janv. 1989
1.031
+0.11
11.96%
1 janv. 1990
1.09
+0.059
5.68%
1 janv. 1991
1.103
+0.013
1.21%
1 janv. 1992
1.002
-0.102
-9.2%
1 janv. 1993
0.939
-0.063
-6.29%
1 janv. 1994
1.471
+0.533
56.73%
1 janv. 1995
1.754
+0.283
19.22%
1 janv. 1996
1.982
+0.228
12.98%
1 janv. 1997
2.309
+0.327
16.52%
1 janv. 1998
2.329
+0.02
0.85%
1 janv. 1999
2.332
+0.003
0.13%
1 janv. 2000
2.404
+0.072
3.1%
1 janv. 2001
2.568
+0.165
6.85%
1 janv. 2002
2.666
+0.098
3.8%
1 janv. 2003
2.747
+0.081
3.03%
1 janv. 2004
2.96
+0.213
7.76%
1 janv. 2007
3.066
+0.106
3.58%
1 janv. 2008
2.927
-0.139
-4.54%
1 janv. 2009
2.939
+0.012
0.42%
1 janv. 2010
3.553
+0.613
20.87%
1 janv. 2012
3.999
+0.447
12.57%
1 janv. 2013
4.786
+0.786
19.67%
1 janv. 2014
5.756
+0.97
20.27%
1 janv. 2015
6.551
+0.796
13.82%
Classement des pays selon les statistiques actuelles par années


Commentaires: