29
/fr/
fr
AIzaSyAYiBZKx7MnpbEhh9jyipgxe19OcubqV5w
April 1, 2024
220890
Paraguay
PRY
true
2
1
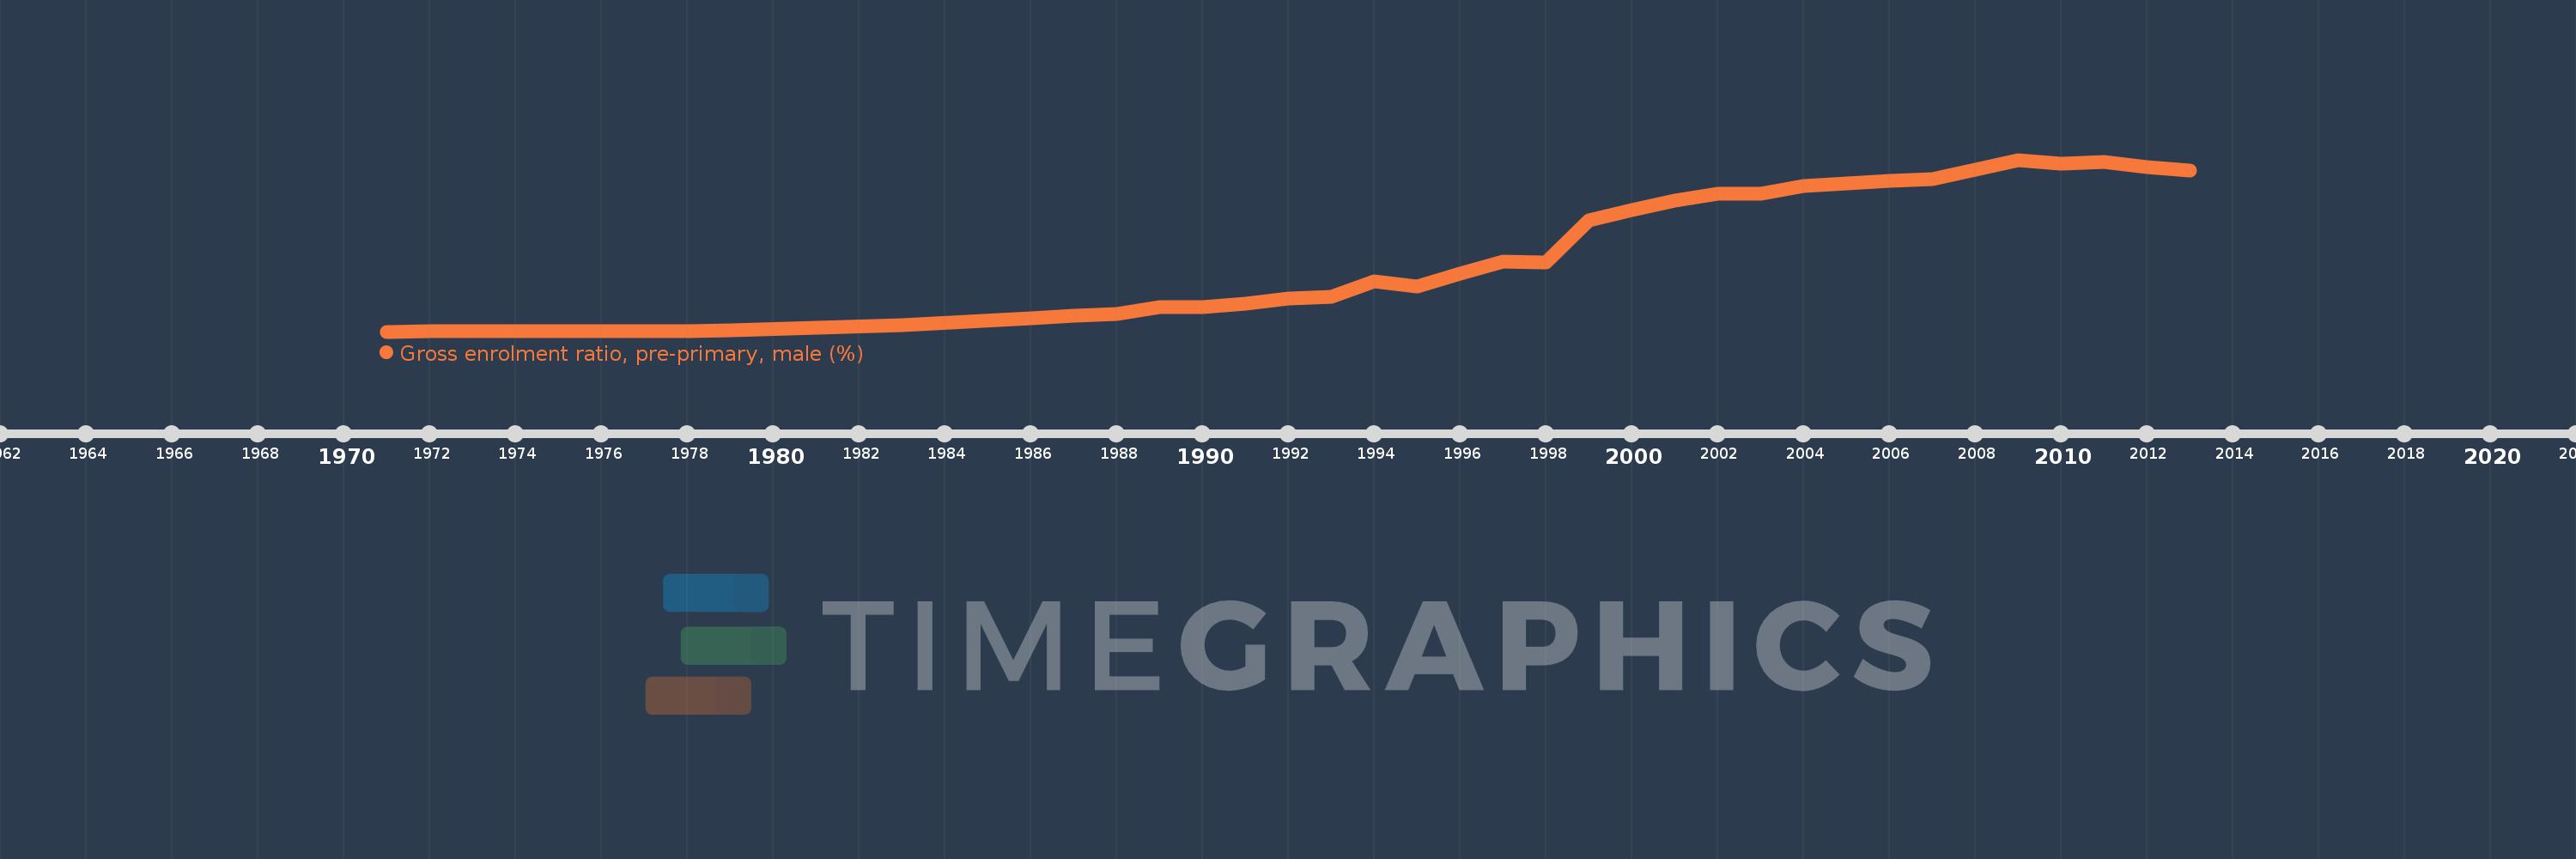
Gross enrolment ratio, pre-primary, male (%)
2013,2012,2011,2010,2009,2008,2007,2006,2005,2004,2003,2002,2001,2000,1999,1998,1997,1996,1995,1994,1993,1992,1991,1990,1989,1988,1987,1986,1983,1979,1978,1974,1972,1971
Cette statistique dans les autres pays:
AfghanistanAlbaniaAlgeriaAndorraAngolaAntigua and BarbudaArab WorldArgentinaArmeniaArubaAustraliaAustriaAzerbaijanBahamas, TheBahrainBangladeshBarbadosBelarusBelgiumBelizeBeninBermudaBhutanBoliviaBosnia and HerzegovinaBotswanaBrazilBrunei DarussalamBulgariaBurkina FasoBurundiCabo VerdeCambodiaCameroonCanadaCaribbean small statesCentral African RepublicCentral Europe and the BalticsChadChileChinaColombiaComorosCongo, Dem. Rep.Congo, Rep.Costa RicaCote d'IvoireCroatiaCubaCyprusCzech RepublicDenmarkDjiboutiDominicaDominican RepublicEarly-demographic dividendEast Asia & PacificEast Asia & Pacific (excluding high income)East Asia & Pacific (IDA & IBRD countries)EcuadorEgypt, Arab Rep.El SalvadorEquatorial GuineaEritreaEstoniaEthiopiaEuro areaEurope & Central AsiaEurope & Central Asia (excluding high income)Europe & Central Asia (IDA & IBRD countries)European UnionFijiFinlandFragile and conflict affected situationsFranceGabonGambia, TheGeorgiaGermanyGhanaGreeceGrenadaGuatemalaGuineaGuinea-BissauGuyanaHeavily indebted poor countries (HIPC)High incomeHondurasHong Kong SAR, ChinaHungaryIBRD onlyIcelandIDA & IBRD totalIDA blendIDA onlyIDA totalIndiaIndonesiaIran, Islamic Rep.IraqIrelandIsraelItalyJamaicaJapanJordanKazakhstanKenyaKorea, Dem. People’s Rep.Korea, Rep.KuwaitKyrgyz RepublicLao PDRLate-demographic dividendLatin America & Caribbean Latin America & Caribbean (excluding high income)Latin America & the Caribbean (IDA & IBRD countries)LatviaLeast developed countries: UN classificationLebanonLesothoLiberiaLibyaLiechtensteinLithuaniaLow & middle incomeLow incomeLower middle incomeLuxembourgMacao SAR, ChinaMacedonia, FYRMadagascarMaldivesMaliMaltaMarshall IslandsMauritaniaMauritiusMexicoMicronesia, Fed. Sts.Middle East & North AfricaMiddle East & North Africa (excluding high income)Middle East & North Africa (IDA & IBRD countries)Middle incomeMoldovaMongoliaMontenegroMoroccoMozambiqueMyanmarNamibiaNauruNepalNetherlandsNew ZealandNicaraguaNigerNigeriaNorth AmericaNorwayOECD membersOmanOther small statesPacific island small statesPakistanPalauPanamaPapua New GuineaParaguayPeruPhilippinesPolandPortugalPost-demographic dividendPre-demographic dividendPuerto RicoQatarRomaniaRussian FederationRwandaSamoaSan MarinoSao Tome and PrincipeSaudi ArabiaSenegalSerbiaSeychellesSierra LeoneSlovak RepublicSloveniaSmall statesSolomon IslandsSomaliaSouth AfricaSouth AsiaSouth Asia (IDA & IBRD)South SudanSpainSri LankaSt. Kitts and NevisSt. LuciaSt. Vincent and the GrenadinesSub-Saharan Africa Sub-Saharan Africa (excluding high income)Sub-Saharan Africa (IDA & IBRD countries)SudanSurinameSwazilandSwedenSwitzerlandSyrian Arab RepublicTajikistanTanzaniaThailandTimor-LesteTogoTongaTrinidad and TobagoTunisiaTurkeyTurkmenistanTuvaluUgandaUkraineUnited Arab EmiratesUnited KingdomUnited StatesUpper middle incomeUruguayUzbekistanVanuatuVenezuela, RBVietnamWest Bank and GazaWorldYemen, Rep.Zimbabwe La ligne de temps
Cette échelle de temps montre un graphique de 1971 année à 2013 année Paraguay. Les données jusqu'à 1970 année ne sont pas présentés. Quantité d'observations actuelles selon dates: 34.
Source (désignation):
Les indicateurs du développement mondiale
Source (organisation):
UNESCO Institute for Statistics
Catégories:
Education, Gender
Dernière mise à jour
23 avr. 2017
Les indicateurs de changement de valeurs selon les années
Maximum:
40.009
1 janv. 2009
Pour la date d''observation
Valeur
Changement absolu
Le changement par rapport à la valeur précédente
1 janv. 1971
3.03
+3.03
0.0%
1 janv. 1972
3.16
+0.13
4.28%
1 janv. 1974
3.039
-0.121
-3.84%
1 janv. 1978
3.032
-0.007
-0.24%
1 janv. 1979
3.277
+0.245
8.07%
1 janv. 1983
4.497
+1.22
37.24%
1 janv. 1986
5.816
+1.319
29.33%
1 janv. 1987
6.406
+0.59
10.15%
1 janv. 1988
6.856
+0.45
7.03%
1 janv. 1989
8.353
+1.496
21.83%
1 janv. 1990
8.214
-0.139
-1.67%
1 janv. 1991
9.038
+0.825
10.04%
1 janv. 1992
10.122
+1.084
11.99%
1 janv. 1993
10.601
+0.479
4.74%
1 janv. 1994
13.892
+3.291
31.04%
1 janv. 1995
12.817
-1.075
-7.74%
1 janv. 1996
15.559
+2.742
21.39%
1 janv. 1997
18.062
+2.503
16.09%
1 janv. 1998
17.992
-0.07
-0.39%
1 janv. 1999
26.996
+9.004
50.05%
1 janv. 2000
29.232
+2.236
8.28%
1 janv. 2001
31.159
+1.927
6.59%
1 janv. 2002
32.778
+1.618
5.19%
1 janv. 2003
32.793
+0.016
0.05%
1 janv. 2004
34.385
+1.592
4.85%
1 janv. 2005
34.893
+0.508
1.48%
1 janv. 2006
35.492
+0.598
1.72%
1 janv. 2007
35.834
+0.342
0.96%
1 janv. 2008
37.792
+1.958
5.46%
1 janv. 2009
40.009
+2.217
5.87%
1 janv. 2010
39.208
-0.801
-2.0%
1 janv. 2011
39.48
+0.272
0.69%
1 janv. 2012
38.364
-1.116
-2.83%
1 janv. 2013
37.648
-0.716
-1.87%
Classement des pays selon les statistiques actuelles par années


Commentaires: