29
/fr/
fr
AIzaSyAYiBZKx7MnpbEhh9jyipgxe19OcubqV5w
April 1, 2024
87245
Bolivia
BOL
true
2
1
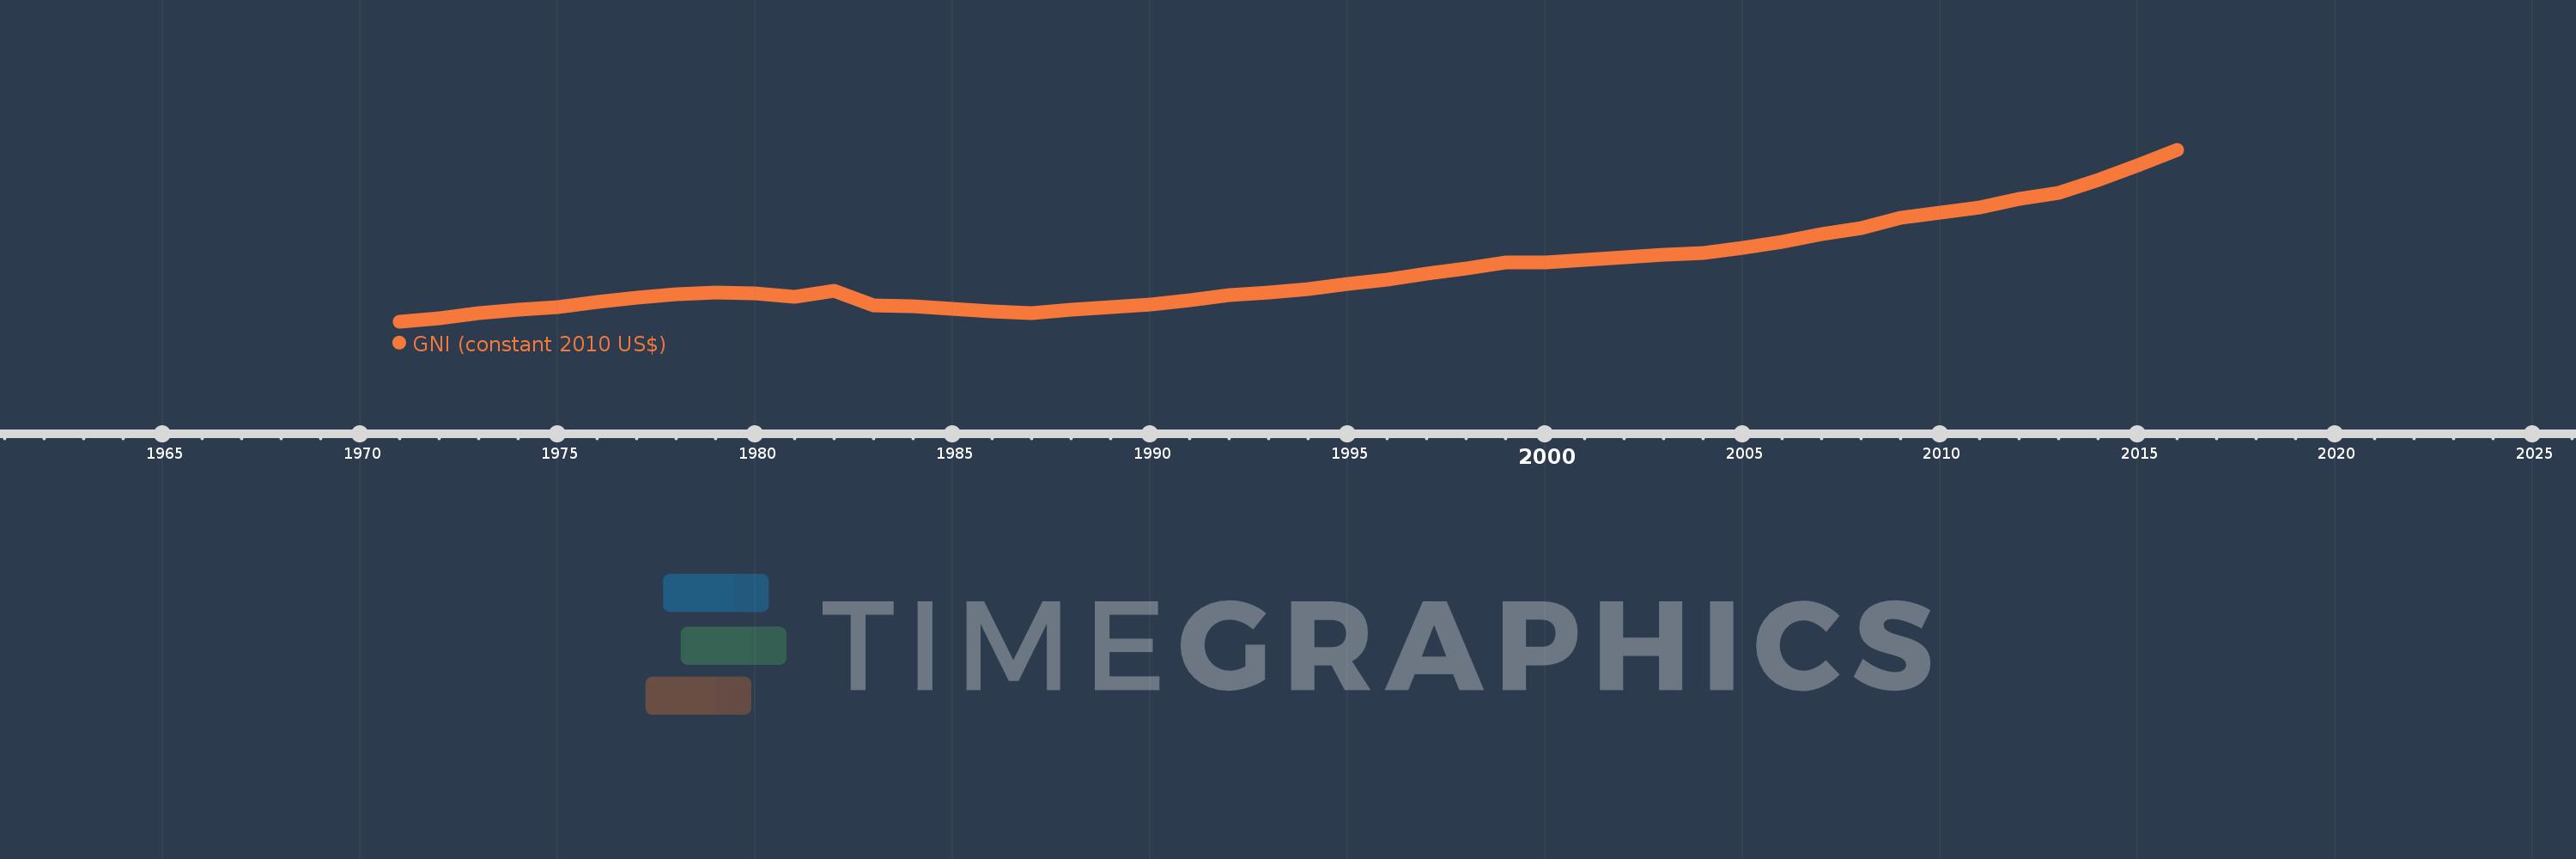
GNI (constant 2010 US$)
2016,2015,2014,2013,2012,2011,2010,2009,2008,2007,2006,2005,2004,2003,2002,2001,2000,1999,1998,1997,1996,1995,1994,1993,1992,1991,1990,1989,1988,1987,1986,1985,1984,1983,1982,1981,1980,1979,1978,1977,1976,1975,1974,1973,1972,1971
Cette statistique dans les autres pays:
AfghanistanAlbaniaAlgeriaAndorraAngolaAntigua and BarbudaArab WorldArgentinaArmeniaAustraliaAustriaAzerbaijanBahamas, TheBahrainBangladeshBarbadosBelarusBelgiumBelizeBeninBermudaBhutanBoliviaBosnia and HerzegovinaBotswanaBrazilBrunei DarussalamBulgariaBurkina FasoBurundiCabo VerdeCambodiaCameroonCanadaCaribbean small statesCentral African RepublicCentral Europe and the BalticsChadChileChinaColombiaComorosCongo, Dem. Rep.Congo, Rep.Costa RicaCote d'IvoireCroatiaCubaCyprusCzech RepublicDenmarkDominicaDominican RepublicEarly-demographic dividendEast Asia & PacificEast Asia & Pacific (excluding high income)East Asia & Pacific (IDA & IBRD countries)EcuadorEgypt, Arab Rep.El SalvadorEquatorial GuineaEritreaEstoniaEthiopiaEuro areaEurope & Central AsiaEurope & Central Asia (excluding high income)Europe & Central Asia (IDA & IBRD countries)European UnionFaroe IslandsFijiFinlandFragile and conflict affected situationsFranceGabonGambia, TheGeorgiaGermanyGhanaGreeceGrenadaGuatemalaGuineaGuinea-BissauGuyanaHaitiHeavily indebted poor countries (HIPC)High incomeHondurasHong Kong SAR, ChinaHungaryIBRD onlyIcelandIDA & IBRD totalIDA blendIDA onlyIDA totalIndiaIndonesiaIran, Islamic Rep.IraqIrelandIsle of ManIsraelItalyJamaicaJapanJordanKazakhstanKenyaKiribatiKorea, Rep.KosovoKuwaitKyrgyz RepublicLao PDRLate-demographic dividendLatin America & Caribbean Latin America & Caribbean (excluding high income)Latin America & the Caribbean (IDA & IBRD countries)LatviaLeast developed countries: UN classificationLebanonLesothoLiberiaLibyaLiechtensteinLithuaniaLow & middle incomeLow incomeLower middle incomeLuxembourgMacao SAR, ChinaMacedonia, FYRMadagascarMalawiMalaysiaMaldivesMaliMaltaMarshall IslandsMauritaniaMauritiusMexicoMicronesia, Fed. Sts.Middle East & North AfricaMiddle East & North Africa (excluding high income)Middle East & North Africa (IDA & IBRD countries)Middle incomeMoldovaMongoliaMontenegroMoroccoMozambiqueMyanmarNamibiaNauruNepalNetherlandsNew ZealandNicaraguaNigerNigeriaNorth AmericaNorwayOECD membersOmanOther small statesPacific island small statesPakistanPalauPanamaPapua New GuineaParaguayPeruPhilippinesPolandPortugalPost-demographic dividendPre-demographic dividendPuerto RicoQatarRomaniaRussian FederationRwandaSamoaSao Tome and PrincipeSaudi ArabiaSenegalSerbiaSeychellesSierra LeoneSingaporeSlovak RepublicSloveniaSmall statesSolomon IslandsSouth AfricaSouth AsiaSouth Asia (IDA & IBRD)South SudanSpainSri LankaSt. Kitts and NevisSt. LuciaSt. Vincent and the GrenadinesSub-Saharan Africa Sub-Saharan Africa (excluding high income)Sub-Saharan Africa (IDA & IBRD countries)SudanSurinameSwazilandSwedenSwitzerlandTajikistanTanzaniaThailandTimor-LesteTogoTongaTrinidad and TobagoTunisiaTurkeyTurkmenistanTuvaluUgandaUkraineUnited Arab EmiratesUnited KingdomUnited StatesUpper middle incomeUruguayUzbekistanVanuatuVenezuela, RBVietnamWest Bank and GazaWorldYemen, Rep.ZambiaZimbabwe La ligne de temps
Cette échelle de temps montre un graphique de 1971 année à 2016 année Bolivia. Les données jusqu'à 1970 année ne sont pas présentés. Quantité d'observations actuelles selon dates: 46.
Source (désignation):
Les indicateurs du développement mondiale
Source (organisation):
World Bank national accounts data, and OECD National Accounts data files.
Catégories:
Economy & Growth
Dernière mise à jour
23 avr. 2017
Les indicateurs de changement de valeurs selon les années
Minimum:
6.55 mds
1 janv. 1971
Maximum:
24.852 mds
1 janv. 2016
Pour la date d''observation
Valeur
Changement absolu
Le changement par rapport à la valeur précédente
1 janv. 1971
6.55 mds
+6.55 mds
0.0%
1 janv. 1972
6.933 mds
+382.697 mln.
5.84%
1 janv. 1973
7.456 mds
+523.021 mln.
7.54%
1 janv. 1974
7.879 mds
+422.937 mln.
5.67%
1 janv. 1975
8.134 mds
+255.333 mln.
3.24%
1 janv. 1976
8.708 mds
+573.826 mln.
7.05%
1 janv. 1977
9.121 mds
+413.35 mln.
4.75%
1 janv. 1978
9.491 mds
+369.93 mln.
4.06%
1 janv. 1979
9.644 mds
+152.897 mln.
1.61%
1 janv. 1980
9.571 mds
-72.821 mln.
-0.76%
1 janv. 1981
9.24 mds
-331.734 mln.
-3.47%
1 janv. 1982
9.897 mds
+657.633 mln.
7.12%
1 janv. 1983
8.302 mds
-1.595 mds
-16.12%
1 janv. 1984
8.258 mds
-44.312 mln.
-0.53%
1 janv. 1985
7.938 mds
-319.39 mln.
-3.87%
1 janv. 1986
7.688 mds
-250.007 mln.
-3.15%
1 janv. 1987
7.513 mds
-174.942 mln.
-2.28%
1 janv. 1988
7.848 mds
+334.539 mln.
4.45%
1 janv. 1989
8.109 mds
+260.907 mln.
3.32%
1 janv. 1990
8.452 mds
+343.589 mln.
4.24%
1 janv. 1991
8.878 mds
+425.835 mln.
5.04%
1 janv. 1992
9.4 mds
+521.523 mln.
5.87%
1 janv. 1993
9.672 mds
+272.222 mln.
2.9%
1 janv. 1994
10.071 mds
+399.034 mln.
4.13%
1 janv. 1995
10.585 mds
+514.386 mln.
5.11%
1 janv. 1996
11.061 mds
+475.865 mln.
4.5%
1 janv. 1997
11.663 mds
+601.428 mln.
5.44%
1 janv. 1998
12.208 mds
+545.652 mln.
4.68%
1 janv. 1999
12.894 mds
+685.754 mln.
5.62%
1 janv. 2000
12.892 mds
-2.509 mln.
-0.02%
1 janv. 2001
13.176 mds
+284.562 mln.
2.21%
1 janv. 2002
13.41 mds
+233.517 mln.
1.77%
1 janv. 2003
13.739 mds
+329.74 mln.
2.46%
1 janv. 2004
13.941 mds
+201.246 mln.
1.46%
1 janv. 2005
14.409 mds
+468.567 mln.
3.36%
1 janv. 2006
15.115 mds
+705.909 mln.
4.9%
1 janv. 2007
15.897 mds
+781.474 mln.
5.17%
1 janv. 2008
16.582 mds
+685.659 mln.
4.31%
1 janv. 2009
17.689 mds
+1.107 mds
6.67%
1 janv. 2010
18.179 mds
+489.7 mln.
2.77%
1 janv. 2011
18.786 mds
+606.769 mln.
3.34%
1 janv. 2012
19.638 mds
+852.832 mln.
4.54%
1 janv. 2013
20.346 mds
+708.046 mln.
3.61%
1 janv. 2014
21.698 mds
+1.352 mds
6.64%
1 janv. 2015
23.224 mds
+1.526 mds
7.03%
1 janv. 2016
24.852 mds
+1.628 mds
7.01%
Classement des pays selon les statistiques actuelles par années


Commentaires: