29
/fr/
fr
AIzaSyAYiBZKx7MnpbEhh9jyipgxe19OcubqV5w
April 1, 2024
210386
Nicaragua
NIC
true
2
1
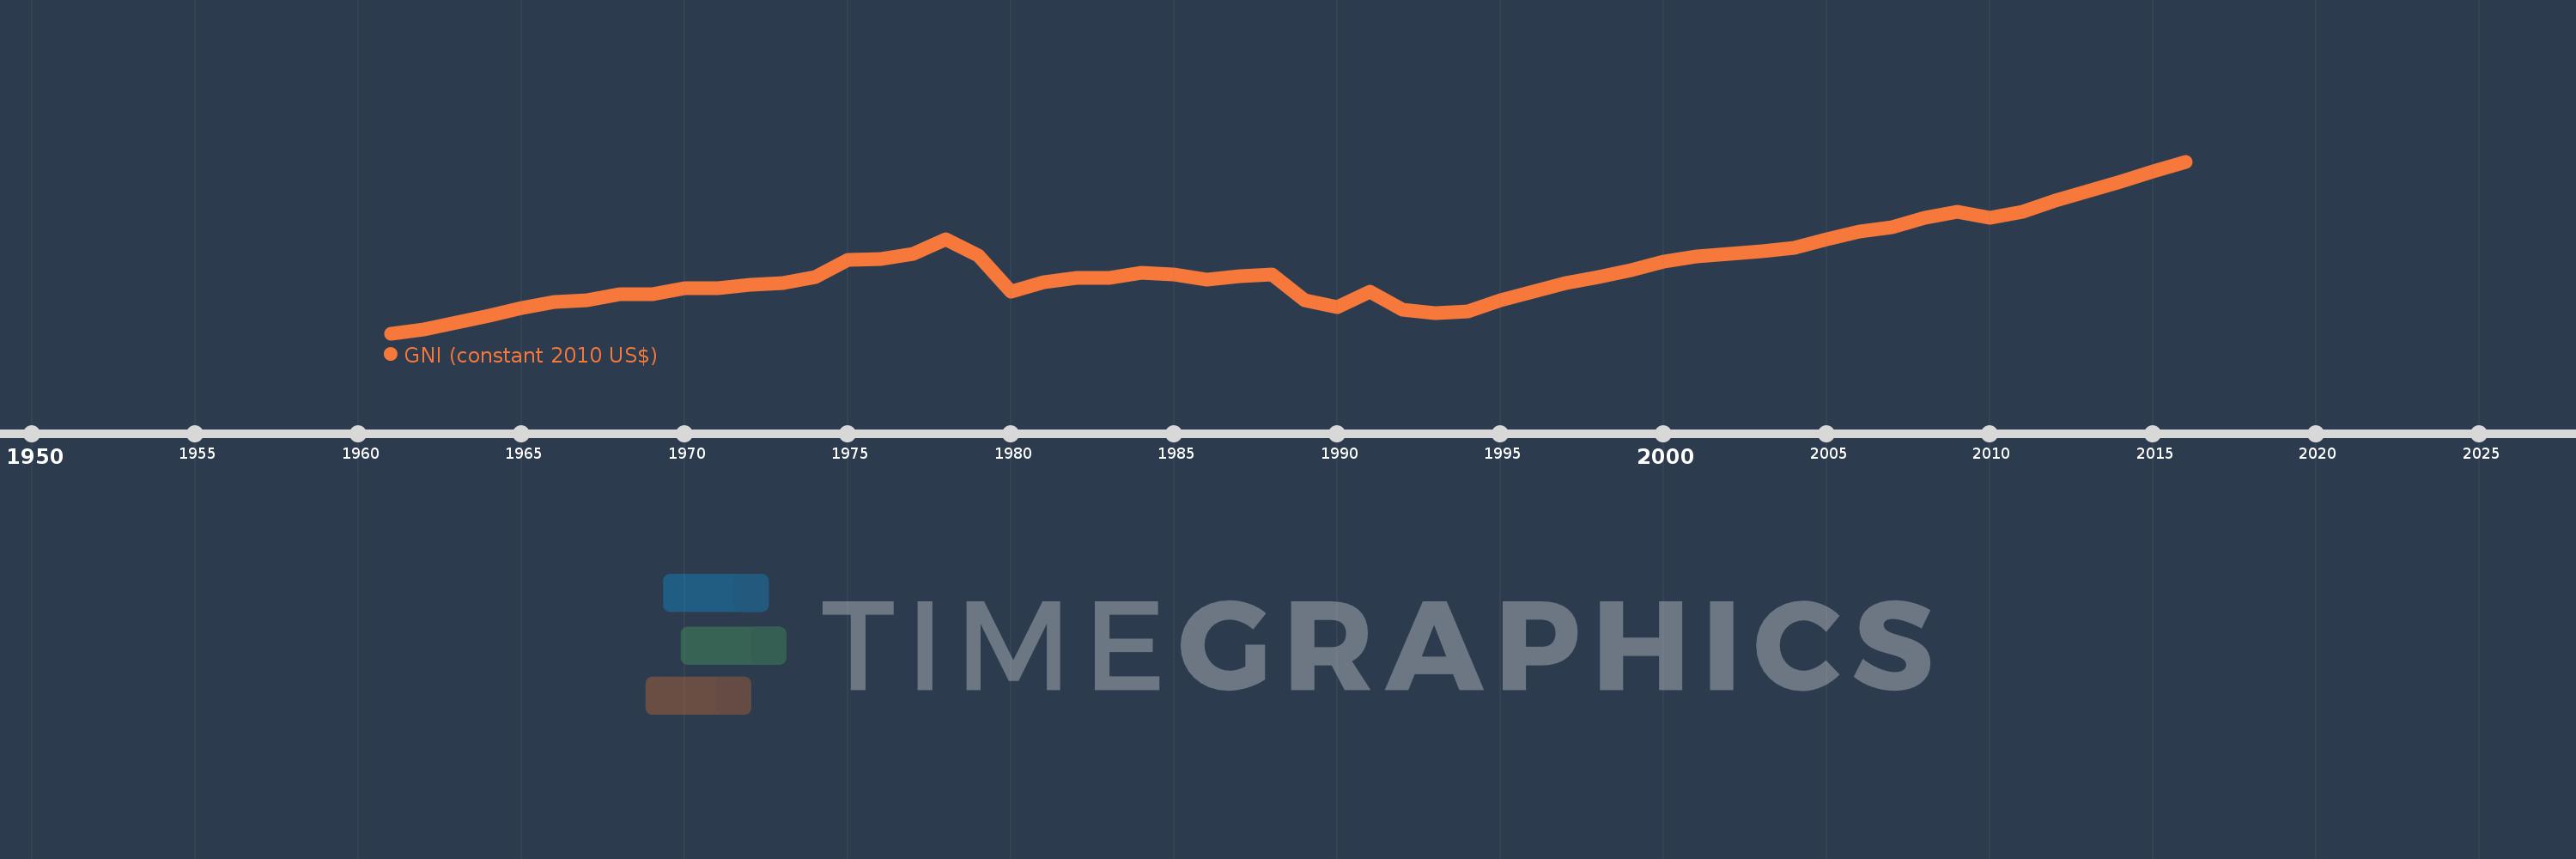
GNI (constant 2010 US$)
2016,2015,2014,2013,2012,2011,2010,2009,2008,2007,2006,2005,2004,2003,2002,2001,2000,1999,1998,1997,1996,1995,1994,1993,1992,1991,1990,1989,1988,1987,1986,1985,1984,1983,1982,1981,1980,1979,1978,1977,1976,1975,1974,1973,1972,1971,1970,1969,1968,1967,1966,1965,1964,1963,1962,1961
Cette statistique dans les autres pays:
AfghanistanAlbaniaAlgeriaAndorraAngolaAntigua and BarbudaArab WorldArgentinaArmeniaAustraliaAustriaAzerbaijanBahamas, TheBahrainBangladeshBarbadosBelarusBelgiumBelizeBeninBermudaBhutanBoliviaBosnia and HerzegovinaBotswanaBrazilBrunei DarussalamBulgariaBurkina FasoBurundiCabo VerdeCambodiaCameroonCanadaCaribbean small statesCentral African RepublicCentral Europe and the BalticsChadChileChinaColombiaComorosCongo, Dem. Rep.Congo, Rep.Costa RicaCote d'IvoireCroatiaCubaCyprusCzech RepublicDenmarkDominicaDominican RepublicEarly-demographic dividendEast Asia & PacificEast Asia & Pacific (excluding high income)East Asia & Pacific (IDA & IBRD countries)EcuadorEgypt, Arab Rep.El SalvadorEquatorial GuineaEritreaEstoniaEthiopiaEuro areaEurope & Central AsiaEurope & Central Asia (excluding high income)Europe & Central Asia (IDA & IBRD countries)European UnionFaroe IslandsFijiFinlandFragile and conflict affected situationsFranceGabonGambia, TheGeorgiaGermanyGhanaGreeceGrenadaGuatemalaGuineaGuinea-BissauGuyanaHaitiHeavily indebted poor countries (HIPC)High incomeHondurasHong Kong SAR, ChinaHungaryIBRD onlyIcelandIDA & IBRD totalIDA blendIDA onlyIDA totalIndiaIndonesiaIran, Islamic Rep.IraqIrelandIsle of ManIsraelItalyJamaicaJapanJordanKazakhstanKenyaKiribatiKorea, Rep.KosovoKuwaitKyrgyz RepublicLao PDRLate-demographic dividendLatin America & Caribbean Latin America & Caribbean (excluding high income)Latin America & the Caribbean (IDA & IBRD countries)LatviaLeast developed countries: UN classificationLebanonLesothoLiberiaLibyaLiechtensteinLithuaniaLow & middle incomeLow incomeLower middle incomeLuxembourgMacao SAR, ChinaMacedonia, FYRMadagascarMalawiMalaysiaMaldivesMaliMaltaMarshall IslandsMauritaniaMauritiusMexicoMicronesia, Fed. Sts.Middle East & North AfricaMiddle East & North Africa (excluding high income)Middle East & North Africa (IDA & IBRD countries)Middle incomeMoldovaMongoliaMontenegroMoroccoMozambiqueMyanmarNamibiaNauruNepalNetherlandsNew ZealandNicaraguaNigerNigeriaNorth AmericaNorwayOECD membersOmanOther small statesPacific island small statesPakistanPalauPanamaPapua New GuineaParaguayPeruPhilippinesPolandPortugalPost-demographic dividendPre-demographic dividendPuerto RicoQatarRomaniaRussian FederationRwandaSamoaSao Tome and PrincipeSaudi ArabiaSenegalSerbiaSeychellesSierra LeoneSingaporeSlovak RepublicSloveniaSmall statesSolomon IslandsSouth AfricaSouth AsiaSouth Asia (IDA & IBRD)South SudanSpainSri LankaSt. Kitts and NevisSt. LuciaSt. Vincent and the GrenadinesSub-Saharan Africa Sub-Saharan Africa (excluding high income)Sub-Saharan Africa (IDA & IBRD countries)SudanSurinameSwazilandSwedenSwitzerlandTajikistanTanzaniaThailandTimor-LesteTogoTongaTrinidad and TobagoTunisiaTurkeyTurkmenistanTuvaluUgandaUkraineUnited Arab EmiratesUnited KingdomUnited StatesUpper middle incomeUruguayUzbekistanVanuatuVenezuela, RBVietnamWest Bank and GazaWorldYemen, Rep.ZambiaZimbabwe La ligne de temps
Cette échelle de temps montre un graphique de 1961 année à 2016 année Nicaragua. Les données jusqu'à 1960 année ne sont pas présentés. Quantité d'observations actuelles selon dates: 56.
Source (désignation):
Les indicateurs du développement mondiale
Source (organisation):
World Bank national accounts data, and OECD National Accounts data files.
Catégories:
Economy & Growth
Dernière mise à jour
23 avr. 2017
Les indicateurs de changement de valeurs selon les années
Minimum:
2.657 mds
1 janv. 1961
Maximum:
10.931 mds
1 janv. 2016
Pour la date d''observation
Valeur
Changement absolu
Le changement par rapport à la valeur précédente
1 janv. 1961
2.657 mds
+2.657 mds
0.0%
1 janv. 1962
2.848 mds
+191.502 mln.
7.21%
1 janv. 1963
3.178 mds
+329.807 mln.
11.58%
1 janv. 1964
3.503 mds
+325.023 mln.
10.23%
1 janv. 1965
3.873 mds
+369.735 mln.
10.55%
1 janv. 1966
4.185 mds
+312.549 mln.
8.07%
1 janv. 1967
4.265 mds
+79.884 mln.
1.91%
1 janv. 1968
4.54 mds
+274.258 mln.
6.43%
1 janv. 1969
4.529 mds
-10.372 mln.
-0.23%
1 janv. 1970
4.831 mds
+301.597 mln.
6.66%
1 janv. 1971
4.828 mds
-3.227 mln.
-0.07%
1 janv. 1972
5.006 mds
+178.499 mln.
3.7%
1 janv. 1973
5.063 mds
+56.628 mln.
1.13%
1 janv. 1974
5.387 mds
+323.941 mln.
6.4%
1 janv. 1975
6.214 mds
+827.265 mln.
15.36%
1 janv. 1976
6.254 mds
+39.772 mln.
0.64%
1 janv. 1977
6.504 mds
+250.22 mln.
4.0%
1 janv. 1978
7.17 mds
+665.997 mln.
10.24%
1 janv. 1979
6.39 mds
-779.665 mln.
-10.87%
1 janv. 1980
4.669 mds
-1.721 mds
-26.94%
1 janv. 1981
5.121 mds
+451.612 mln.
9.67%
1 janv. 1982
5.327 mds
+206.404 mln.
4.03%
1 janv. 1983
5.321 mds
-5.585 mln.
-0.1%
1 janv. 1984
5.563 mds
+241.656 mln.
4.54%
1 janv. 1985
5.511 mds
-52.369 mln.
-0.94%
1 janv. 1986
5.234 mds
-276.505 mln.
-5.02%
1 janv. 1987
5.427 mds
+192.488 mln.
3.68%
1 janv. 1988
5.487 mds
+60.415 mln.
1.11%
1 janv. 1989
4.245 mds
-1.242 mds
-22.64%
1 janv. 1990
3.903 mds
-341.78 mln.
-8.05%
1 janv. 1991
4.655 mds
+751.803 mln.
19.26%
1 janv. 1992
3.802 mds
-852.536 mln.
-18.32%
1 janv. 1993
3.643 mds
-159.708 mln.
-4.2%
1 janv. 1994
3.717 mds
+74.456 mln.
2.04%
1 janv. 1995
4.255 mds
+538.418 mln.
14.49%
1 janv. 1996
4.684 mds
+428.423 mln.
10.07%
1 janv. 1997
5.073 mds
+389.49 mln.
8.32%
1 janv. 1998
5.365 mds
+291.18 mln.
5.74%
1 janv. 1999
5.688 mds
+323.455 mln.
6.03%
1 janv. 2000
6.091 mds
+403.034 mln.
7.09%
1 janv. 2001
6.351 mds
+259.733 mln.
4.26%
1 janv. 2002
6.5 mds
+149.525 mln.
2.35%
1 janv. 2003
6.59 mds
+90.103 mln.
1.39%
1 janv. 2004
6.775 mds
+184.865 mln.
2.81%
1 janv. 2005
7.17 mds
+394.268 mln.
5.82%
1 janv. 2006
7.552 mds
+382.253 mln.
5.33%
1 janv. 2007
7.746 mds
+194.1 mln.
2.57%
1 janv. 2008
8.227 mds
+481.189 mln.
6.21%
1 janv. 2009
8.492 mds
+265.158 mln.
3.22%
1 janv. 2010
8.214 mds
-278.514 mln.
-3.28%
1 janv. 2011
8.5 mds
+286.708 mln.
3.49%
1 janv. 2012
9.047 mds
+546.168 mln.
6.43%
1 janv. 2013
9.499 mds
+452.539 mln.
5.0%
1 janv. 2014
9.947 mds
+448.198 mln.
4.72%
1 janv. 2015
10.436 mds
+488.835 mln.
4.91%
1 janv. 2016
10.931 mds
+494.857 mln.
4.74%
Classement des pays selon les statistiques actuelles par années


Commentaires: