29
/fr/
fr
AIzaSyAYiBZKx7MnpbEhh9jyipgxe19OcubqV5w
April 1, 2024
264618
Togo
TGO
true
2
1
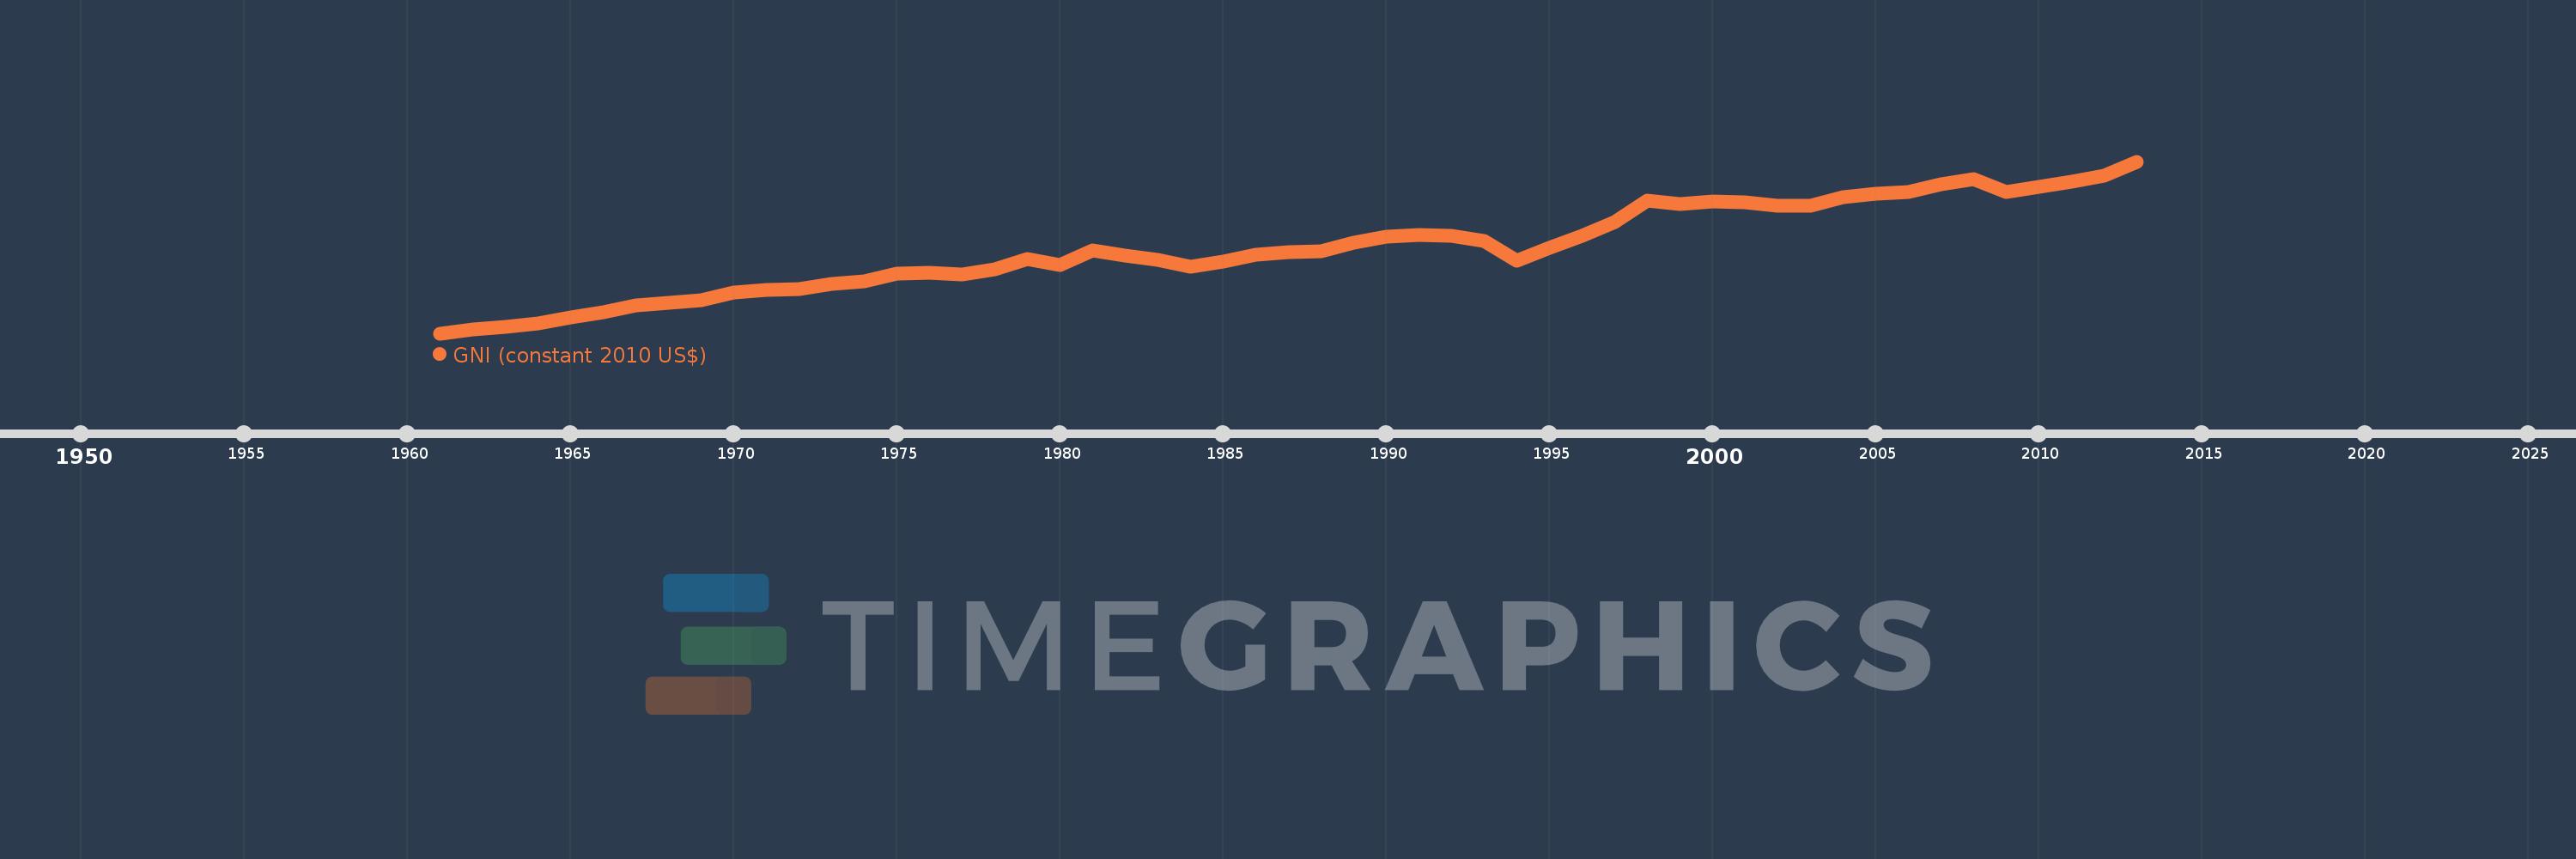
GNI (constant 2010 US$)
2013,2012,2011,2010,2009,2008,2007,2006,2005,2004,2003,2002,2001,2000,1999,1998,1997,1996,1995,1994,1993,1992,1991,1990,1989,1988,1987,1986,1985,1984,1983,1982,1981,1980,1979,1978,1977,1976,1975,1974,1973,1972,1971,1970,1969,1968,1967,1966,1965,1964,1963,1962,1961
Cette statistique dans les autres pays:
AfghanistanAlbaniaAlgeriaAndorraAngolaAntigua and BarbudaArab WorldArgentinaArmeniaAustraliaAustriaAzerbaijanBahamas, TheBahrainBangladeshBarbadosBelarusBelgiumBelizeBeninBermudaBhutanBoliviaBosnia and HerzegovinaBotswanaBrazilBrunei DarussalamBulgariaBurkina FasoBurundiCabo VerdeCambodiaCameroonCanadaCaribbean small statesCentral African RepublicCentral Europe and the BalticsChadChileChinaColombiaComorosCongo, Dem. Rep.Congo, Rep.Costa RicaCote d'IvoireCroatiaCubaCyprusCzech RepublicDenmarkDominicaDominican RepublicEarly-demographic dividendEast Asia & PacificEast Asia & Pacific (excluding high income)East Asia & Pacific (IDA & IBRD countries)EcuadorEgypt, Arab Rep.El SalvadorEquatorial GuineaEritreaEstoniaEthiopiaEuro areaEurope & Central AsiaEurope & Central Asia (excluding high income)Europe & Central Asia (IDA & IBRD countries)European UnionFaroe IslandsFijiFinlandFragile and conflict affected situationsFranceGabonGambia, TheGeorgiaGermanyGhanaGreeceGrenadaGuatemalaGuineaGuinea-BissauGuyanaHaitiHeavily indebted poor countries (HIPC)High incomeHondurasHong Kong SAR, ChinaHungaryIBRD onlyIcelandIDA & IBRD totalIDA blendIDA onlyIDA totalIndiaIndonesiaIran, Islamic Rep.IraqIrelandIsle of ManIsraelItalyJamaicaJapanJordanKazakhstanKenyaKiribatiKorea, Rep.KosovoKuwaitKyrgyz RepublicLao PDRLate-demographic dividendLatin America & Caribbean Latin America & Caribbean (excluding high income)Latin America & the Caribbean (IDA & IBRD countries)LatviaLeast developed countries: UN classificationLebanonLesothoLiberiaLibyaLiechtensteinLithuaniaLow & middle incomeLow incomeLower middle incomeLuxembourgMacao SAR, ChinaMacedonia, FYRMadagascarMalawiMalaysiaMaldivesMaliMaltaMarshall IslandsMauritaniaMauritiusMexicoMicronesia, Fed. Sts.Middle East & North AfricaMiddle East & North Africa (excluding high income)Middle East & North Africa (IDA & IBRD countries)Middle incomeMoldovaMongoliaMontenegroMoroccoMozambiqueMyanmarNamibiaNauruNepalNetherlandsNew ZealandNicaraguaNigerNigeriaNorth AmericaNorwayOECD membersOmanOther small statesPacific island small statesPakistanPalauPanamaPapua New GuineaParaguayPeruPhilippinesPolandPortugalPost-demographic dividendPre-demographic dividendPuerto RicoQatarRomaniaRussian FederationRwandaSamoaSao Tome and PrincipeSaudi ArabiaSenegalSerbiaSeychellesSierra LeoneSingaporeSlovak RepublicSloveniaSmall statesSolomon IslandsSouth AfricaSouth AsiaSouth Asia (IDA & IBRD)South SudanSpainSri LankaSt. Kitts and NevisSt. LuciaSt. Vincent and the GrenadinesSub-Saharan Africa Sub-Saharan Africa (excluding high income)Sub-Saharan Africa (IDA & IBRD countries)SudanSurinameSwazilandSwedenSwitzerlandTajikistanTanzaniaThailandTimor-LesteTogoTongaTrinidad and TobagoTunisiaTurkeyTurkmenistanTuvaluUgandaUkraineUnited Arab EmiratesUnited KingdomUnited StatesUpper middle incomeUruguayUzbekistanVanuatuVenezuela, RBVietnamWest Bank and GazaWorldYemen, Rep.ZambiaZimbabwe La ligne de temps
Cette échelle de temps montre un graphique de 1961 année à 2013 année Togo. Les données jusqu'à 1960 année ne sont pas présentés. Quantité d'observations actuelles selon dates: 53.
Source (désignation):
Les indicateurs du développement mondiale
Source (organisation):
World Bank national accounts data, and OECD National Accounts data files.
Catégories:
Economy & Growth
Dernière mise à jour
23 avr. 2017
Les indicateurs de changement de valeurs selon les années
Minimum:
536.619 mln.
1 janv. 1961
Maximum:
3.051 mds
1 janv. 2013
Pour la date d''observation
Valeur
Changement absolu
Le changement par rapport à la valeur précédente
1 janv. 1961
536.619 mln.
+536.619 mln.
0.0%
1 janv. 1962
597.615 mln.
+60.996 mln.
11.37%
1 janv. 1963
628.333 mln.
+30.718 mln.
5.14%
1 janv. 1964
678.149 mln.
+49.816 mln.
7.93%
1 janv. 1965
770.713 mln.
+92.564 mln.
13.65%
1 janv. 1966
838.954 mln.
+68.241 mln.
8.85%
1 janv. 1967
943.682 mln.
+104.728 mln.
12.48%
1 janv. 1968
985.449 mln.
+41.766 mln.
4.43%
1 janv. 1969
1.025 mds
+39.997 mln.
4.06%
1 janv. 1970
1.139 mds
+113.922 mln.
11.11%
1 janv. 1971
1.171 mds
+31.176 mln.
2.74%
1 janv. 1972
1.179 mds
+8.22 mln.
0.7%
1 janv. 1973
1.262 mds
+82.784 mln.
7.02%
1 janv. 1974
1.3 mds
+38.163 mln.
3.03%
1 janv. 1975
1.405 mds
+105.165 mln.
8.09%
1 janv. 1976
1.428 mds
+22.8 mln.
1.62%
1 janv. 1977
1.398 mds
-29.983 mln.
-2.1%
1 janv. 1978
1.474 mds
+75.866 mln.
5.43%
1 janv. 1979
1.622 mds
+148.908 mln.
10.11%
1 janv. 1980
1.542 mds
-80.295 mln.
-4.95%
1 janv. 1981
1.75 mds
+207.797 mln.
13.47%
1 janv. 1982
1.673 mds
-76.737 mln.
-4.39%
1 janv. 1983
1.606 mds
-67.061 mln.
-4.01%
1 janv. 1984
1.505 mds
-100.955 mln.
-6.29%
1 janv. 1985
1.59 mds
+84.679 mln.
5.63%
1 janv. 1986
1.688 mds
+97.812 mln.
6.15%
1 janv. 1987
1.73 mds
+41.871 mln.
2.48%
1 janv. 1988
1.743 mds
+13.24 mln.
0.77%
1 janv. 1989
1.866 mds
+123.164 mln.
7.07%
1 janv. 1990
1.957 mds
+91.203 mln.
4.89%
1 janv. 1991
1.975 mds
+17.845 mln.
0.91%
1 janv. 1992
1.962 mds
-13.497 mln.
-0.68%
1 janv. 1993
1.89 mds
-71.963 mln.
-3.67%
1 janv. 1994
1.6 mds
-289.422 mln.
-15.32%
1 janv. 1995
1.785 mds
+184.541 mln.
11.53%
1 janv. 1996
1.959 mds
+174.393 mln.
9.77%
1 janv. 1997
2.163 mds
+204.026 mln.
10.41%
1 janv. 1998
2.474 mds
+310.704 mln.
14.36%
1 janv. 1999
2.426 mds
-48.013 mln.
-1.94%
1 janv. 2000
2.461 mds
+35.101 mln.
1.45%
1 janv. 2001
2.449 mds
-11.878 mln.
-0.48%
1 janv. 2002
2.408 mds
-41.026 mln.
-1.68%
1 janv. 2003
2.404 mds
-3.657 mln.
-0.15%
1 janv. 2004
2.526 mds
+122.153 mln.
5.08%
1 janv. 2005
2.574 mds
+47.441 mln.
1.88%
1 janv. 2006
2.609 mds
+34.914 mln.
1.36%
1 janv. 2007
2.714 mds
+105.469 mln.
4.04%
1 janv. 2008
2.789 mds
+74.809 mln.
2.76%
1 janv. 2009
2.602 mds
-186.943 mln.
-6.7%
1 janv. 2010
2.685 mds
+82.867 mln.
3.18%
1 janv. 2011
2.762 mds
+76.563 mln.
2.85%
1 janv. 2012
2.847 mds
+85.317 mln.
3.09%
1 janv. 2013
3.051 mds
+204.289 mln.
7.18%
Classement des pays selon les statistiques actuelles par années


Commentaires: