29
/fr/
fr
AIzaSyAYiBZKx7MnpbEhh9jyipgxe19OcubqV5w
April 1, 2024
84555
Benin
BEN
true
2
1
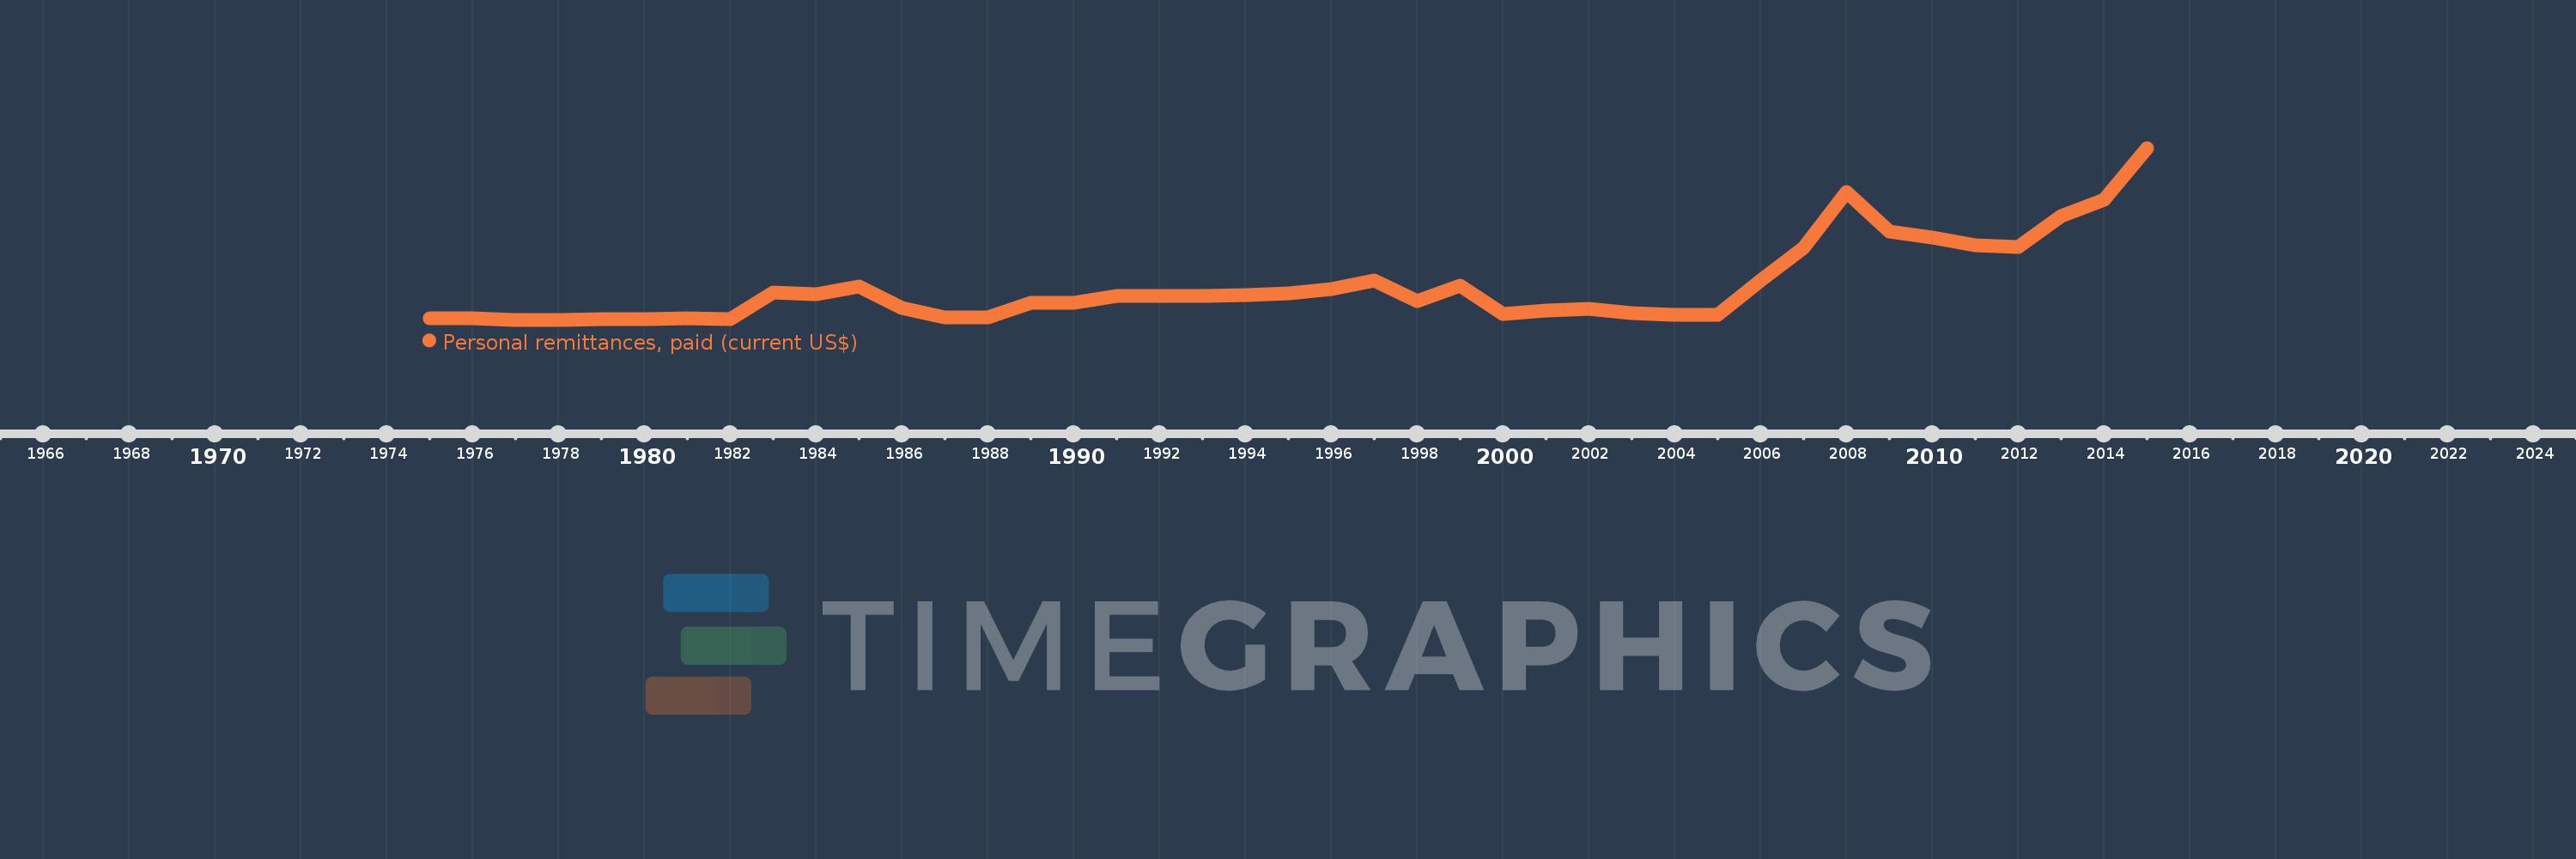
Personal remittances, paid (current US$)
2015,2014,2013,2012,2011,2010,2009,2008,2007,2006,2005,2004,2003,2002,2001,2000,1999,1998,1997,1996,1995,1994,1993,1992,1991,1990,1989,1988,1987,1986,1985,1984,1983,1982,1981,1980,1979,1978,1977,1976,1975
Cette statistique dans les autres pays:
AfghanistanAlbaniaAlgeriaAngolaAntigua and BarbudaArab WorldArgentinaArmeniaArubaAustraliaAustriaAzerbaijanBahamas, TheBahrainBangladeshBarbadosBelarusBelgiumBelizeBeninBermudaBhutanBoliviaBosnia and HerzegovinaBotswanaBrazilBrunei DarussalamBulgariaBurkina FasoBurundiCabo VerdeCambodiaCameroonCanadaCaribbean small statesCentral African RepublicCentral Europe and the BalticsChadChileChinaColombiaComorosCongo, Dem. Rep.Congo, Rep.Costa RicaCote d'IvoireCroatiaCuracaoCyprusCzech RepublicDenmarkDjiboutiDominicaDominican RepublicEarly-demographic dividendEast Asia & PacificEast Asia & Pacific (excluding high income)East Asia & Pacific (IDA & IBRD countries)EcuadorEgypt, Arab Rep.El SalvadorEquatorial GuineaEritreaEstoniaEthiopiaEuro areaEurope & Central AsiaEurope & Central Asia (excluding high income)Europe & Central Asia (IDA & IBRD countries)European UnionFaroe IslandsFijiFinlandFragile and conflict affected situationsFranceFrench PolynesiaGabonGambia, TheGeorgiaGermanyGhanaGreeceGrenadaGuatemalaGuineaGuinea-BissauGuyanaHaitiHeavily indebted poor countries (HIPC)High incomeHondurasHong Kong SAR, ChinaHungaryIBRD onlyIcelandIDA & IBRD totalIDA blendIDA onlyIDA totalIndiaIndonesiaIraqIrelandIsraelItalyJamaicaJapanJordanKazakhstanKenyaKiribatiKorea, Rep.KosovoKuwaitKyrgyz RepublicLao PDRLate-demographic dividendLatin America & Caribbean Latin America & Caribbean (excluding high income)Latin America & the Caribbean (IDA & IBRD countries)LatviaLeast developed countries: UN classificationLebanonLesothoLiberiaLibyaLithuaniaLow & middle incomeLow incomeLower middle incomeLuxembourgMacao SAR, ChinaMacedonia, FYRMadagascarMalawiMalaysiaMaldivesMaliMaltaMarshall IslandsMauritaniaMauritiusMexicoMicronesia, Fed. Sts.Middle East & North AfricaMiddle East & North Africa (excluding high income)Middle East & North Africa (IDA & IBRD countries)Middle incomeMoldovaMongoliaMontenegroMoroccoMozambiqueMyanmarNamibiaNepalNetherlandsNew CaledoniaNew ZealandNicaraguaNigerNigeriaNorth AmericaNorwayOECD membersOmanOther small statesPacific island small statesPakistanPalauPanamaPapua New GuineaParaguayPeruPhilippinesPolandPortugalPost-demographic dividendPre-demographic dividendQatarRomaniaRussian FederationRwandaSamoaSao Tome and PrincipeSaudi ArabiaSenegalSerbiaSeychellesSierra LeoneSint Maarten (Dutch part)Slovak RepublicSloveniaSmall statesSolomon IslandsSomaliaSouth AfricaSouth AsiaSouth Asia (IDA & IBRD)South SudanSpainSri LankaSt. Kitts and NevisSt. LuciaSt. Vincent and the GrenadinesSub-Saharan Africa Sub-Saharan Africa (excluding high income)Sub-Saharan Africa (IDA & IBRD countries)SudanSurinameSwazilandSwedenSwitzerlandSyrian Arab RepublicTajikistanTanzaniaThailandTimor-LesteTogoTongaTrinidad and TobagoTunisiaTurkeyTurkmenistanTuvaluUgandaUkraineUnited KingdomUnited StatesUpper middle incomeUruguayVanuatuVenezuela, RBVietnamWest Bank and GazaWorldYemen, Rep.ZambiaZimbabwe La ligne de temps
Cette échelle de temps montre un graphique de 1975 année à 2015 année Benin. Les données jusqu'à 1974 année ne sont pas présentés. Quantité d'observations actuelles selon dates: 41.
Source (désignation):
Les indicateurs du développement mondiale
Source (organisation):
World Bank staff estimates based on IMF balance of payments data.
Catégories:
Economy & Growth, Financial Sector
Dernière mise à jour
23 avr. 2017
Les indicateurs de changement de valeurs selon les années
Minimum:
1.209 mln.
1 janv. 1978
Maximum:
144.171 mln.
1 janv. 2015
Pour la date d''observation
Valeur
Changement absolu
Le changement par rapport à la valeur précédente
1 janv. 1975
2.688 mln.
+2.688 mln.
0.0%
1 janv. 1976
2.664 mln.
-23.613 milles
-0.88%
1 janv. 1977
1.331 mln.
-1.334 mln.
-50.05%
1 janv. 1978
1.209 mln.
-121.928 milles
-9.16%
1 janv. 1979
1.511 mln.
+302.259 milles
25.0%
1 janv. 1980
1.843 mln.
+331.633 milles
21.95%
1 janv. 1981
2.12 mln.
+277.629 milles
15.07%
1 janv. 1982
1.899 mln.
-221.48 milles
-10.45%
1 janv. 1983
23.773 mln.
+21.874 mln.
1.15 milles%
1 janv. 1984
22.295 mln.
-1.478 mln.
-6.22%
1 janv. 1985
28.694 mln.
+6.399 mln.
28.7%
1 janv. 1986
11.129 mln.
-17.565 mln.
-61.21%
1 janv. 1987
2.888 mln.
-8.242 mln.
-74.05%
1 janv. 1988
3.327 mln.
+439.762 milles
15.23%
1 janv. 1989
15.517 mln.
+12.19 mln.
366.34%
1 janv. 1990
15.151 mln.
-365.634 milles
-2.36%
1 janv. 1991
20.688 mln.
+5.536 mln.
36.54%
1 janv. 1992
20.728 mln.
+40.022 milles
0.19%
1 janv. 1993
21.149 mln.
+421.52 milles
2.03%
1 janv. 1994
21.459 mln.
+309.572 milles
1.46%
1 janv. 1995
23.252 mln.
+1.793 mln.
8.36%
1 janv. 1996
26.485 mln.
+3.233 mln.
13.9%
1 janv. 1997
33.615 mln.
+7.131 mln.
26.92%
1 janv. 1998
17.064 mln.
-16.551 mln.
-49.24%
1 janv. 1999
29.877 mln.
+12.813 mln.
75.08%
1 janv. 2000
5.935 mln.
-23.942 mln.
-80.14%
1 janv. 2001
8.88 mln.
+2.945 mln.
49.62%
1 janv. 2002
10.259 mln.
+1.379 mln.
15.53%
1 janv. 2003
6.617 mln.
-3.642 mln.
-35.5%
1 janv. 2004
5.236 mln.
-1.381 mln.
-20.88%
1 janv. 2005
5.628 mln.
+391.93 milles
7.49%
1 janv. 2006
33.528 mln.
+27.9 mln.
495.77%
1 janv. 2007
60.791 mln.
+27.263 mln.
81.31%
1 janv. 2008
107.546 mln.
+46.755 mln.
76.91%
1 janv. 2009
74.314 mln.
-33.232 mln.
-30.9%
1 janv. 2010
69.947 mln.
-4.367 mln.
-5.88%
1 janv. 2011
63.379 mln.
-6.568 mln.
-9.39%
1 janv. 2012
61.551 mln.
-1.827 mln.
-2.88%
1 janv. 2013
87.747 mln.
+26.196 mln.
42.56%
1 janv. 2014
101.034 mln.
+13.287 mln.
15.14%
1 janv. 2015
144.171 mln.
+43.137 mln.
42.7%
Classement des pays selon les statistiques actuelles par années


Commentaires: