29
/fr/
fr
AIzaSyAYiBZKx7MnpbEhh9jyipgxe19OcubqV5w
April 1, 2024
26809
Early-demographic dividend
EAR
false
2
1
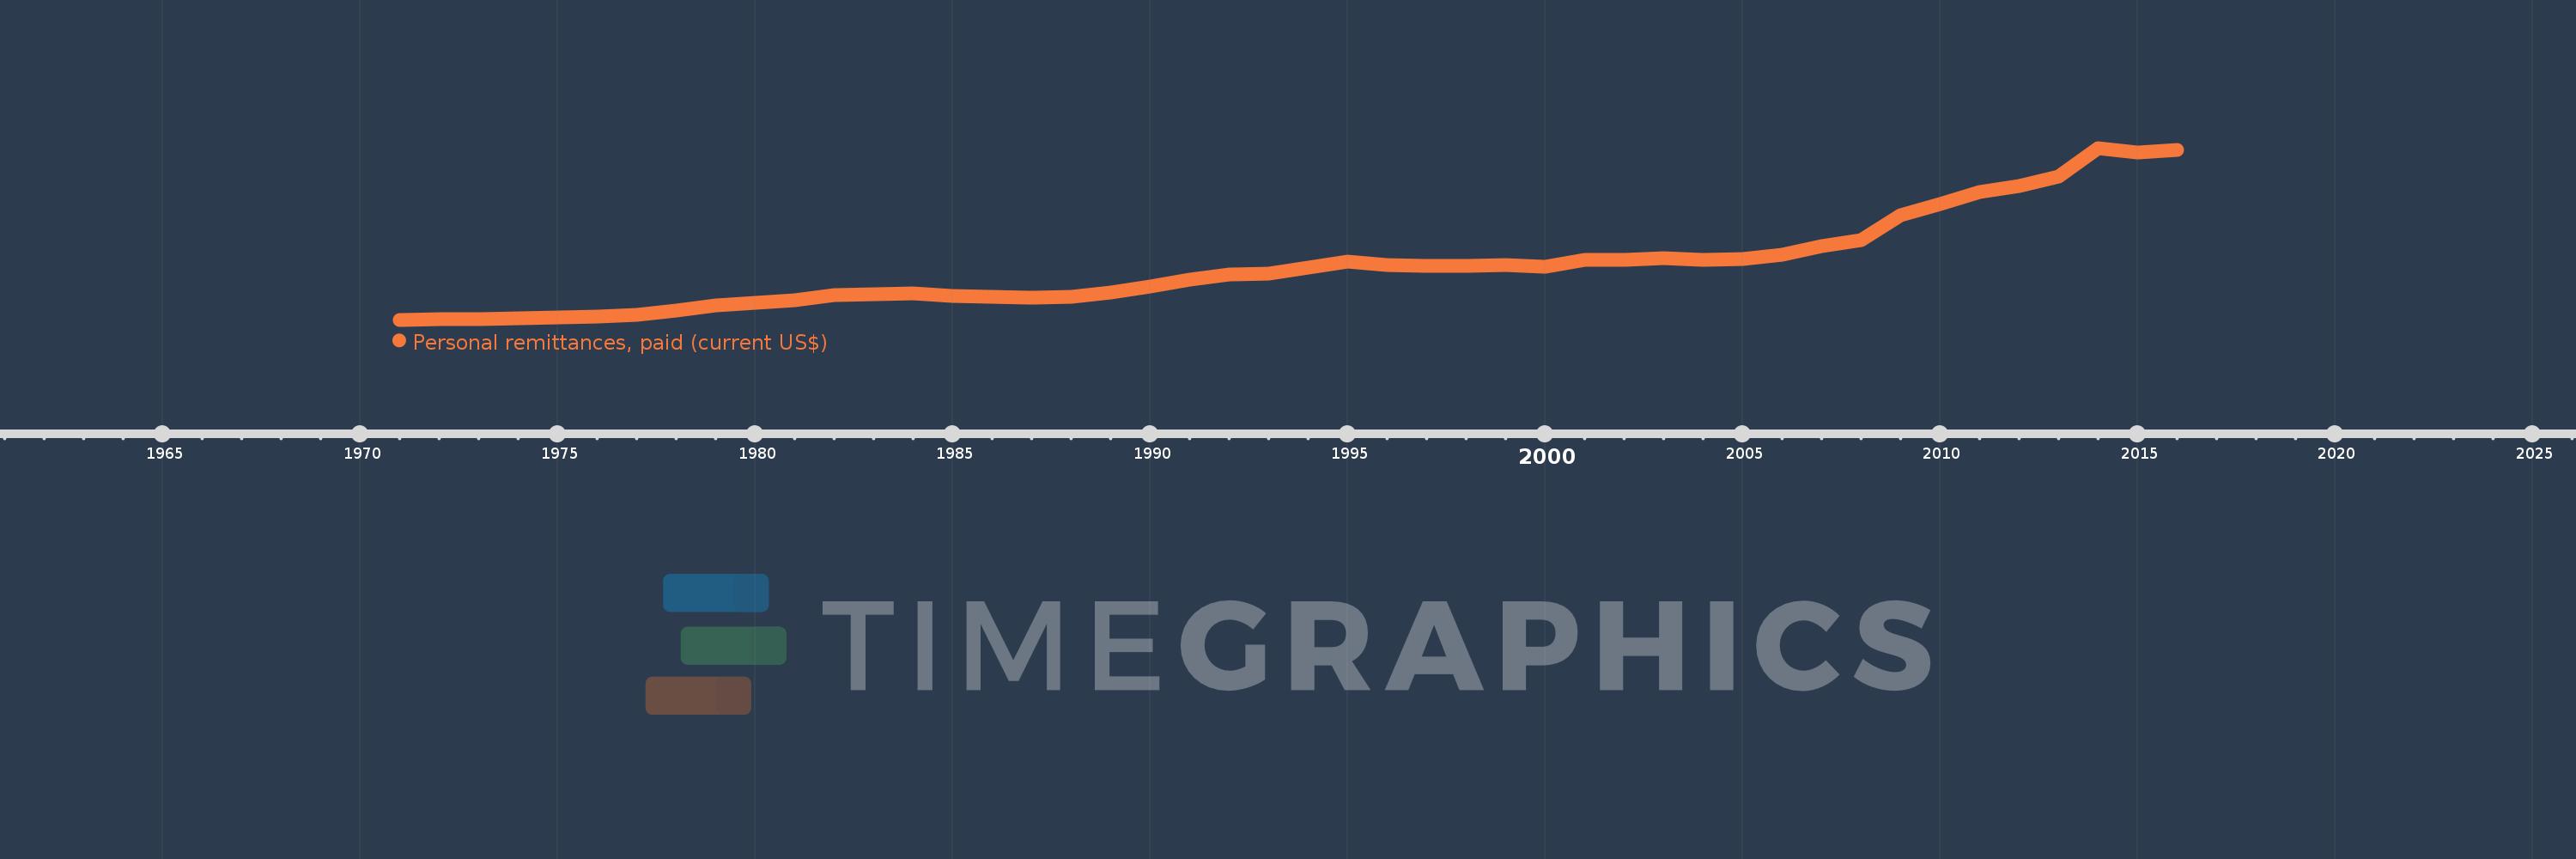
Personal remittances, paid (current US$)
2016,2015,2014,2013,2012,2011,2010,2009,2008,2007,2006,2005,2004,2003,2002,2001,2000,1999,1998,1997,1996,1995,1994,1993,1992,1991,1990,1989,1988,1987,1986,1985,1984,1983,1982,1981,1980,1979,1978,1977,1976,1975,1974,1973,1972,1971
Cette statistique dans les autres pays:
AfghanistanAlbaniaAlgeriaAngolaAntigua and BarbudaArab WorldArgentinaArmeniaArubaAustraliaAustriaAzerbaijanBahamas, TheBahrainBangladeshBarbadosBelarusBelgiumBelizeBeninBermudaBhutanBoliviaBosnia and HerzegovinaBotswanaBrazilBrunei DarussalamBulgariaBurkina FasoBurundiCabo VerdeCambodiaCameroonCanadaCaribbean small statesCentral African RepublicCentral Europe and the BalticsChadChileChinaColombiaComorosCongo, Dem. Rep.Congo, Rep.Costa RicaCote d'IvoireCroatiaCuracaoCyprusCzech RepublicDenmarkDjiboutiDominicaDominican RepublicEarly-demographic dividendEast Asia & PacificEast Asia & Pacific (excluding high income)East Asia & Pacific (IDA & IBRD countries)EcuadorEgypt, Arab Rep.El SalvadorEquatorial GuineaEritreaEstoniaEthiopiaEuro areaEurope & Central AsiaEurope & Central Asia (excluding high income)Europe & Central Asia (IDA & IBRD countries)European UnionFaroe IslandsFijiFinlandFragile and conflict affected situationsFranceFrench PolynesiaGabonGambia, TheGeorgiaGermanyGhanaGreeceGrenadaGuatemalaGuineaGuinea-BissauGuyanaHaitiHeavily indebted poor countries (HIPC)High incomeHondurasHong Kong SAR, ChinaHungaryIBRD onlyIcelandIDA & IBRD totalIDA blendIDA onlyIDA totalIndiaIndonesiaIraqIrelandIsraelItalyJamaicaJapanJordanKazakhstanKenyaKiribatiKorea, Rep.KosovoKuwaitKyrgyz RepublicLao PDRLate-demographic dividendLatin America & Caribbean Latin America & Caribbean (excluding high income)Latin America & the Caribbean (IDA & IBRD countries)LatviaLeast developed countries: UN classificationLebanonLesothoLiberiaLibyaLithuaniaLow & middle incomeLow incomeLower middle incomeLuxembourgMacao SAR, ChinaMacedonia, FYRMadagascarMalawiMalaysiaMaldivesMaliMaltaMarshall IslandsMauritaniaMauritiusMexicoMicronesia, Fed. Sts.Middle East & North AfricaMiddle East & North Africa (excluding high income)Middle East & North Africa (IDA & IBRD countries)Middle incomeMoldovaMongoliaMontenegroMoroccoMozambiqueMyanmarNamibiaNepalNetherlandsNew CaledoniaNew ZealandNicaraguaNigerNigeriaNorth AmericaNorwayOECD membersOmanOther small statesPacific island small statesPakistanPalauPanamaPapua New GuineaParaguayPeruPhilippinesPolandPortugalPost-demographic dividendPre-demographic dividendQatarRomaniaRussian FederationRwandaSamoaSao Tome and PrincipeSaudi ArabiaSenegalSerbiaSeychellesSierra LeoneSint Maarten (Dutch part)Slovak RepublicSloveniaSmall statesSolomon IslandsSomaliaSouth AfricaSouth AsiaSouth Asia (IDA & IBRD)South SudanSpainSri LankaSt. Kitts and NevisSt. LuciaSt. Vincent and the GrenadinesSub-Saharan Africa Sub-Saharan Africa (excluding high income)Sub-Saharan Africa (IDA & IBRD countries)SudanSurinameSwazilandSwedenSwitzerlandSyrian Arab RepublicTajikistanTanzaniaThailandTimor-LesteTogoTongaTrinidad and TobagoTunisiaTurkeyTurkmenistanTuvaluUgandaUkraineUnited KingdomUnited StatesUpper middle incomeUruguayVanuatuVenezuela, RBVietnamWest Bank and GazaWorldYemen, Rep.ZambiaZimbabwe La ligne de temps
Cette échelle de temps montre un graphique de 1971 année à 2016 année Early-demographic dividend. Les données jusqu'à 1970 année ne sont pas présentés. Quantité d'observations actuelles selon dates: 46.
Source (désignation):
Les indicateurs du développement mondiale
Source (organisation):
World Bank staff estimates based on IMF balance of payments data.
Catégories:
Economy & Growth, Financial Sector
Dernière mise à jour
23 avr. 2017
Les indicateurs de changement de valeurs selon les années
Minimum:
334.6 mln.
1 janv. 1971
Maximum:
66.005 mds
1 janv. 2014
Pour la date d''observation
Valeur
Changement absolu
Le changement par rapport à la valeur précédente
1 janv. 1971
334.6 mln.
+334.6 mln.
0.0%
1 janv. 1972
587.538 mln.
+252.938 mln.
75.59%
1 janv. 1973
646.652 mln.
+59.114 mln.
10.06%
1 janv. 1974
935.189 mln.
+288.537 mln.
44.62%
1 janv. 1975
1.24 mds
+304.822 mln.
32.59%
1 janv. 1976
1.692 mds
+452.14 mln.
36.46%
1 janv. 1977
2.222 mds
+529.351 mln.
31.28%
1 janv. 1978
3.948 mds
+1.726 mds
77.71%
1 janv. 1979
5.882 mds
+1.934 mds
49.0%
1 janv. 1980
6.874 mds
+991.857 mln.
16.86%
1 janv. 1981
7.933 mds
+1.059 mds
15.4%
1 janv. 1982
9.615 mds
+1.682 mds
21.21%
1 janv. 1983
10.233 mds
+618.15 mln.
6.43%
1 janv. 1984
10.325 mds
+91.522 mln.
0.89%
1 janv. 1985
9.522 mds
-802.64 mln.
-7.77%
1 janv. 1986
9.085 mds
-437.274 mln.
-4.59%
1 janv. 1987
8.629 mds
-455.659 mln.
-5.02%
1 janv. 1988
9.029 mds
+399.407 mln.
4.63%
1 janv. 1989
10.739 mds
+1.71 mds
18.94%
1 janv. 1990
12.889 mds
+2.15 mds
20.02%
1 janv. 1991
15.748 mds
+2.86 mds
22.19%
1 janv. 1992
17.784 mds
+2.036 mds
12.93%
1 janv. 1993
18.094 mds
+309.186 mln.
1.74%
1 janv. 1994
20.18 mds
+2.086 mds
11.53%
1 janv. 1995
22.637 mds
+2.457 mds
12.18%
1 janv. 1996
21.388 mds
-1.249 mds
-5.52%
1 janv. 1997
21.042 mds
-345.617 mln.
-1.62%
1 janv. 1998
20.865 mds
-176.966 mln.
-0.84%
1 janv. 1999
21.155 mds
+290.223 mln.
1.39%
1 janv. 2000
20.44 mds
-715.579 mln.
-3.38%
1 janv. 2001
23.113 mds
+2.673 mds
13.08%
1 janv. 2002
23.321 mds
+207.933 mln.
0.9%
1 janv. 2003
23.825 mds
+504.328 mln.
2.16%
1 janv. 2004
23.072 mds
-753.479 mln.
-3.16%
1 janv. 2005
23.485 mds
+413.133 mln.
1.79%
1 janv. 2006
25.146 mds
+1.661 mds
7.07%
1 janv. 2007
28.412 mds
+3.267 mds
12.99%
1 janv. 2008
30.889 mds
+2.477 mds
8.72%
1 janv. 2009
40.201 mds
+9.311 mds
30.14%
1 janv. 2010
44.508 mds
+4.307 mds
10.71%
1 janv. 2011
49.154 mds
+4.646 mds
10.44%
1 janv. 2012
51.353 mds
+2.199 mds
4.47%
1 janv. 2013
55.232 mds
+3.879 mds
7.55%
1 janv. 2014
66.005 mds
+10.773 mds
19.5%
1 janv. 2015
64.199 mds
-1.805 mds
-2.74%
1 janv. 2016
65.193 mds
+993.832 mln.
1.55%
Classement des pays selon les statistiques actuelles par années


Commentaires: