29
/fr/
fr
AIzaSyAYiBZKx7MnpbEhh9jyipgxe19OcubqV5w
April 1, 2024
74278
Austria
AUT
true
2
1
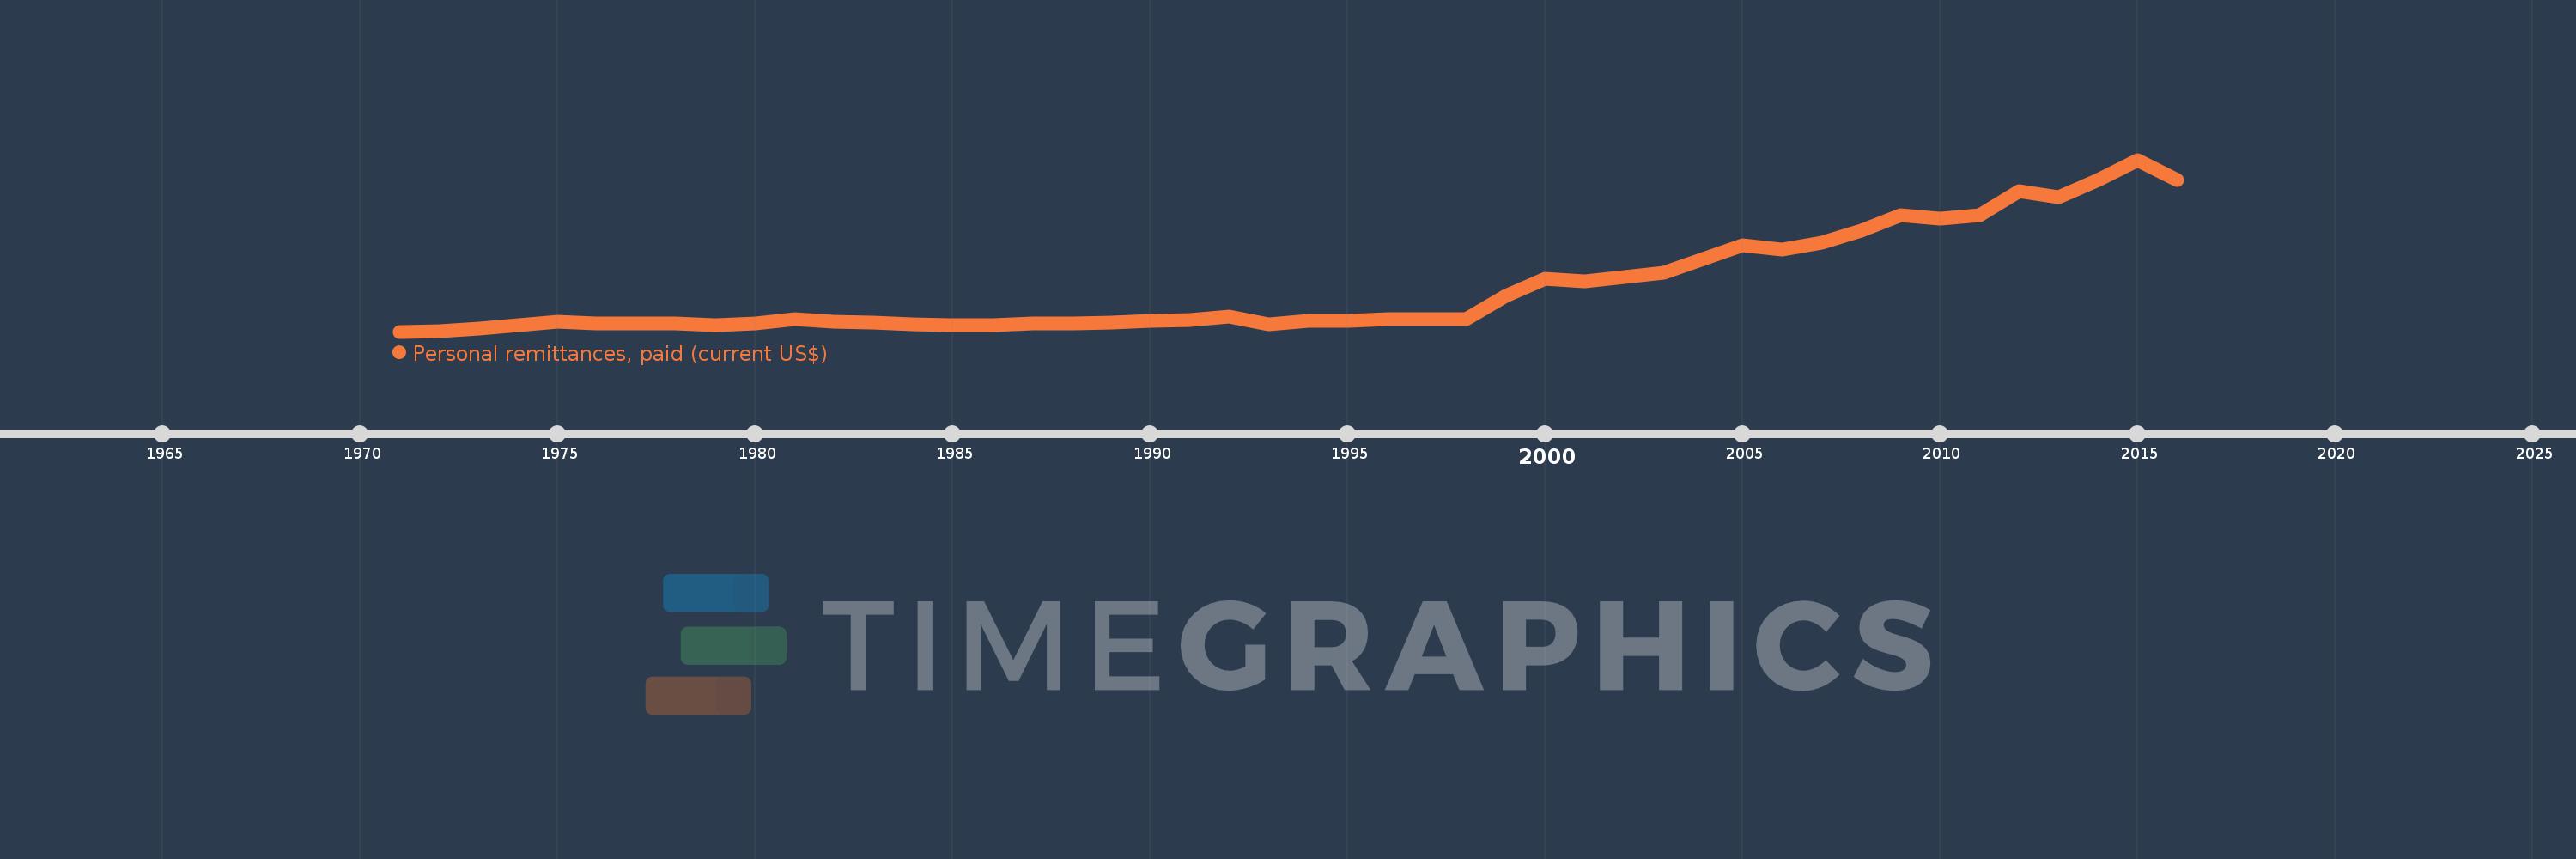
Personal remittances, paid (current US$)
2016,2015,2014,2013,2012,2011,2010,2009,2008,2007,2006,2005,2004,2003,2002,2001,2000,1999,1998,1997,1996,1995,1994,1993,1992,1991,1990,1989,1988,1987,1986,1985,1984,1983,1982,1981,1980,1979,1978,1977,1976,1975,1974,1973,1972,1971
Cette statistique dans les autres pays:
AfghanistanAlbaniaAlgeriaAngolaAntigua and BarbudaArab WorldArgentinaArmeniaArubaAustraliaAustriaAzerbaijanBahamas, TheBahrainBangladeshBarbadosBelarusBelgiumBelizeBeninBermudaBhutanBoliviaBosnia and HerzegovinaBotswanaBrazilBrunei DarussalamBulgariaBurkina FasoBurundiCabo VerdeCambodiaCameroonCanadaCaribbean small statesCentral African RepublicCentral Europe and the BalticsChadChileChinaColombiaComorosCongo, Dem. Rep.Congo, Rep.Costa RicaCote d'IvoireCroatiaCuracaoCyprusCzech RepublicDenmarkDjiboutiDominicaDominican RepublicEarly-demographic dividendEast Asia & PacificEast Asia & Pacific (excluding high income)East Asia & Pacific (IDA & IBRD countries)EcuadorEgypt, Arab Rep.El SalvadorEquatorial GuineaEritreaEstoniaEthiopiaEuro areaEurope & Central AsiaEurope & Central Asia (excluding high income)Europe & Central Asia (IDA & IBRD countries)European UnionFaroe IslandsFijiFinlandFragile and conflict affected situationsFranceFrench PolynesiaGabonGambia, TheGeorgiaGermanyGhanaGreeceGrenadaGuatemalaGuineaGuinea-BissauGuyanaHaitiHeavily indebted poor countries (HIPC)High incomeHondurasHong Kong SAR, ChinaHungaryIBRD onlyIcelandIDA & IBRD totalIDA blendIDA onlyIDA totalIndiaIndonesiaIraqIrelandIsraelItalyJamaicaJapanJordanKazakhstanKenyaKiribatiKorea, Rep.KosovoKuwaitKyrgyz RepublicLao PDRLate-demographic dividendLatin America & Caribbean Latin America & Caribbean (excluding high income)Latin America & the Caribbean (IDA & IBRD countries)LatviaLeast developed countries: UN classificationLebanonLesothoLiberiaLibyaLithuaniaLow & middle incomeLow incomeLower middle incomeLuxembourgMacao SAR, ChinaMacedonia, FYRMadagascarMalawiMalaysiaMaldivesMaliMaltaMarshall IslandsMauritaniaMauritiusMexicoMicronesia, Fed. Sts.Middle East & North AfricaMiddle East & North Africa (excluding high income)Middle East & North Africa (IDA & IBRD countries)Middle incomeMoldovaMongoliaMontenegroMoroccoMozambiqueMyanmarNamibiaNepalNetherlandsNew CaledoniaNew ZealandNicaraguaNigerNigeriaNorth AmericaNorwayOECD membersOmanOther small statesPacific island small statesPakistanPalauPanamaPapua New GuineaParaguayPeruPhilippinesPolandPortugalPost-demographic dividendPre-demographic dividendQatarRomaniaRussian FederationRwandaSamoaSao Tome and PrincipeSaudi ArabiaSenegalSerbiaSeychellesSierra LeoneSint Maarten (Dutch part)Slovak RepublicSloveniaSmall statesSolomon IslandsSomaliaSouth AfricaSouth AsiaSouth Asia (IDA & IBRD)South SudanSpainSri LankaSt. Kitts and NevisSt. LuciaSt. Vincent and the GrenadinesSub-Saharan Africa Sub-Saharan Africa (excluding high income)Sub-Saharan Africa (IDA & IBRD countries)SudanSurinameSwazilandSwedenSwitzerlandSyrian Arab RepublicTajikistanTanzaniaThailandTimor-LesteTogoTongaTrinidad and TobagoTunisiaTurkeyTurkmenistanTuvaluUgandaUkraineUnited KingdomUnited StatesUpper middle incomeUruguayVanuatuVenezuela, RBVietnamWest Bank and GazaWorldYemen, Rep.ZambiaZimbabwe La ligne de temps
Cette échelle de temps montre un graphique de 1971 année à 2016 année Austria. Les données jusqu'à 1970 année ne sont pas présentés. Quantité d'observations actuelles selon dates: 46.
Source (désignation):
Les indicateurs du développement mondiale
Source (organisation):
World Bank staff estimates based on IMF balance of payments data.
Catégories:
Economy & Growth, Financial Sector
Dernière mise à jour
23 avr. 2017
Les indicateurs de changement de valeurs selon les années
Minimum:
24.692 mln.
1 janv. 1971
Maximum:
4.41 mds
1 janv. 2015
Pour la date d''observation
Valeur
Changement absolu
Le changement par rapport à la valeur précédente
1 janv. 1971
24.692 mln.
+24.692 mln.
0.0%
1 janv. 1972
46.597 mln.
+21.904 mln.
88.71%
1 janv. 1973
98.606 mln.
+52.009 mln.
111.61%
1 janv. 1974
181.811 mln.
+83.205 mln.
84.38%
1 janv. 1975
271.194 mln.
+89.384 mln.
49.16%
1 janv. 1976
243.576 mln.
-27.618 mln.
-10.18%
1 janv. 1977
232.827 mln.
-10.75 mln.
-4.41%
1 janv. 1978
239.277 mln.
+6.451 mln.
2.77%
1 janv. 1979
187.292 mln.
-51.985 mln.
-21.73%
1 janv. 1980
231.978 mln.
+44.686 mln.
23.86%
1 janv. 1981
334.47 mln.
+102.492 mln.
44.18%
1 janv. 1982
285.688 mln.
-48.782 mln.
-14.58%
1 janv. 1983
265.836 mln.
-19.852 mln.
-6.95%
1 janv. 1984
214.98 mln.
-50.856 mln.
-19.13%
1 janv. 1985
194.568 mln.
-20.413 mln.
-9.5%
1 janv. 1986
189.676 mln.
-4.891 mln.
-2.51%
1 janv. 1987
224.539 mln.
+34.863 mln.
18.38%
1 janv. 1988
228.747 mln.
+4.208 mln.
1.87%
1 janv. 1989
251.341 mln.
+22.594 mln.
9.88%
1 janv. 1990
302.311 mln.
+50.969 mln.
20.28%
1 janv. 1991
319.779 mln.
+17.468 mln.
5.78%
1 janv. 1992
415.872 mln.
+96.092 mln.
30.05%
1 janv. 1993
206.126 mln.
-209.745 mln.
-50.44%
1 janv. 1994
288.914 mln.
+82.788 mln.
40.16%
1 janv. 1995
292.412 mln.
+3.498 mln.
1.21%
1 janv. 1996
345.817 mln.
+53.405 mln.
18.26%
1 janv. 1997
346.234 mln.
+416.84 milles
0.12%
1 janv. 1998
342.774 mln.
-3.46 mln.
-1.0%
1 janv. 1999
932.068 mln.
+589.293 mln.
171.92%
1 janv. 2000
1.37 mds
+438.262 mln.
47.02%
1 janv. 2001
1.298 mds
-72.269 mln.
-5.27%
1 janv. 2002
1.422 mds
+123.831 mln.
9.54%
1 janv. 2003
1.518 mds
+95.778 mln.
6.74%
1 janv. 2004
1.874 mds
+356.52 mln.
23.49%
1 janv. 2005
2.228 mds
+353.657 mln.
18.87%
1 janv. 2006
2.12 mds
-108.269 mln.
-4.86%
1 janv. 2007
2.301 mds
+181.68 mln.
8.57%
1 janv. 2008
2.593 mds
+291.303 mln.
12.66%
1 janv. 2009
2.985 mds
+392.59 mln.
15.14%
1 janv. 2010
2.907 mds
-78.379 mln.
-2.63%
1 janv. 2011
2.991 mds
+83.86 mln.
2.88%
1 janv. 2012
3.62 mds
+629.842 mln.
21.06%
1 janv. 2013
3.452 mds
-168.5 mln.
-4.65%
1 janv. 2014
3.896 mds
+443.883 mln.
12.86%
1 janv. 2015
4.41 mds
+514.293 mln.
13.2%
1 janv. 2016
3.886 mds
-524.557 mln.
-11.89%
Classement des pays selon les statistiques actuelles par années


Commentaires: