29
/fr/
fr
AIzaSyAYiBZKx7MnpbEhh9jyipgxe19OcubqV5w
April 1, 2024
84084
Benin
BEN
true
2
1
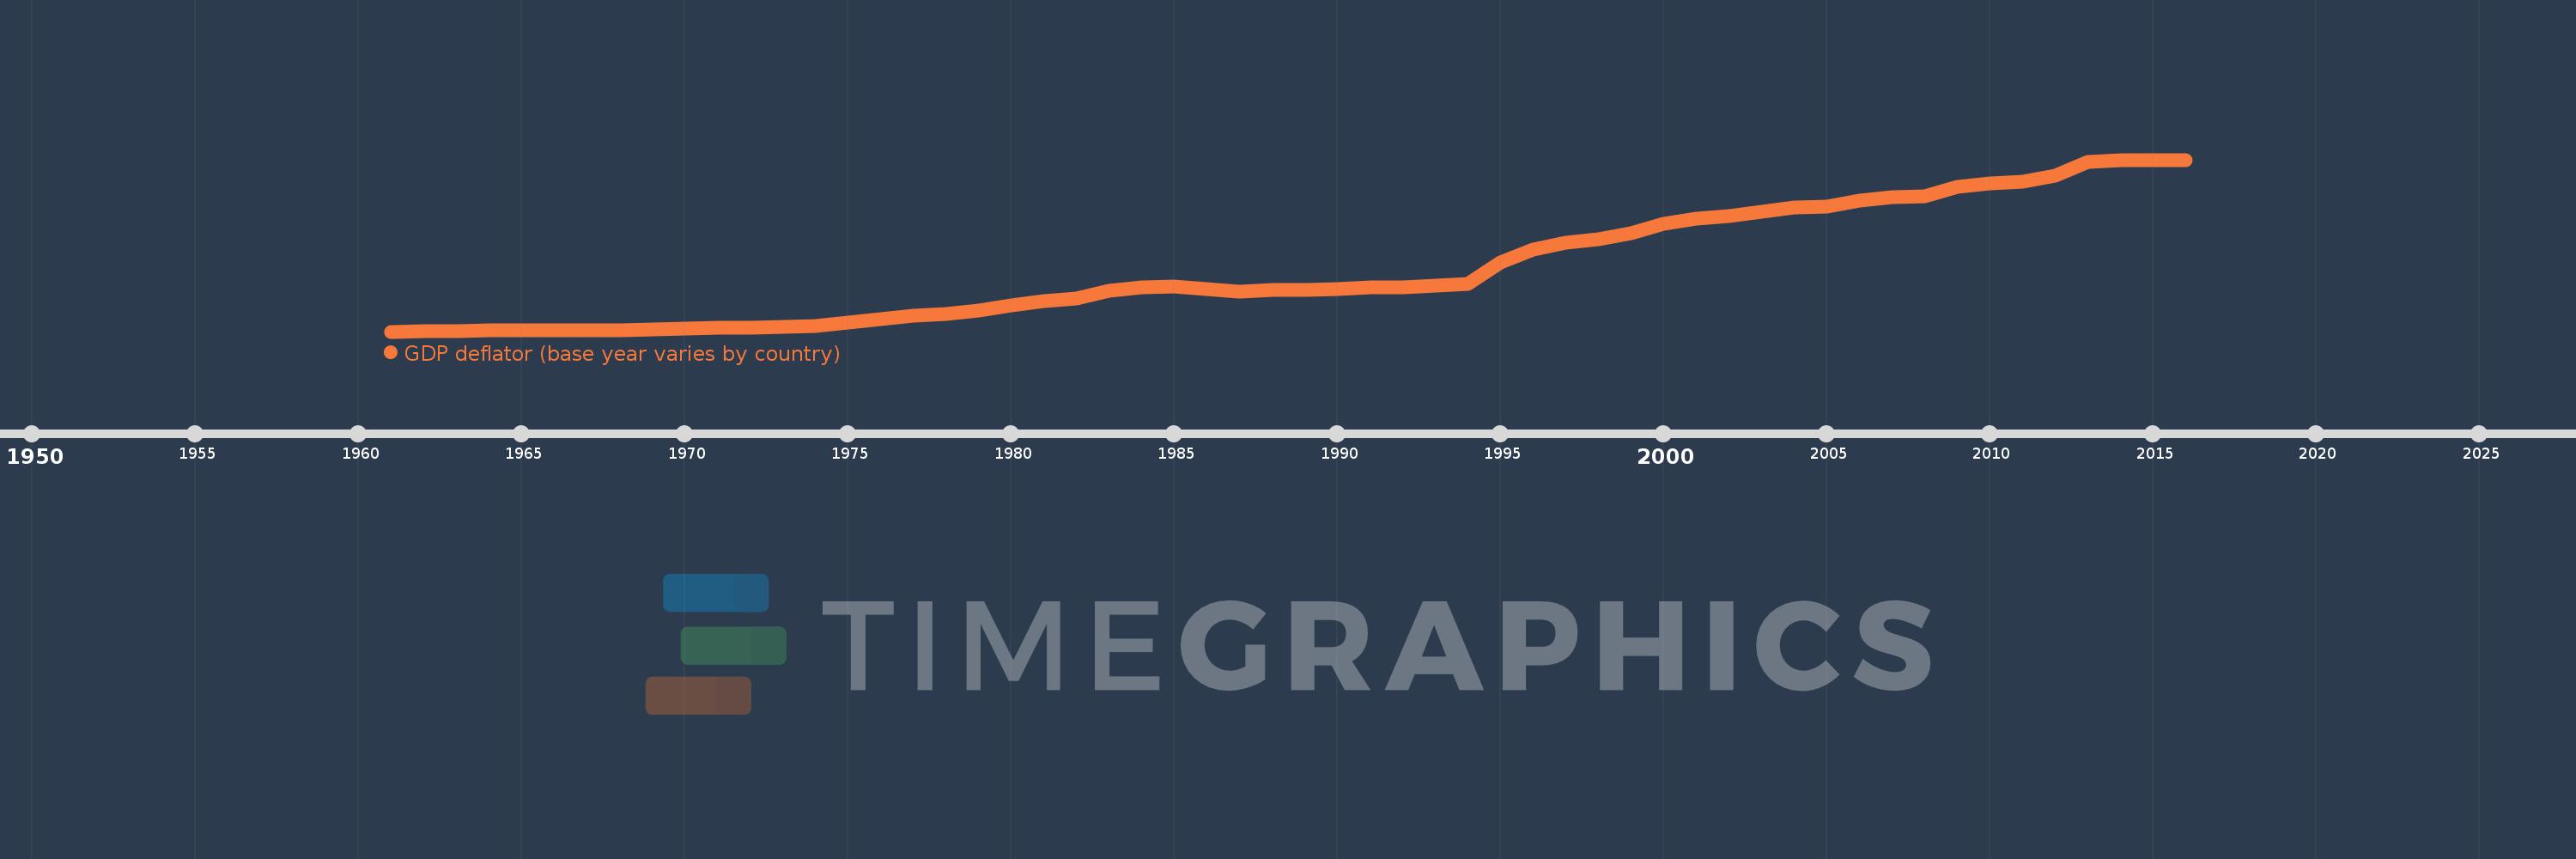
GDP deflator (base year varies by country)
2016,2015,2014,2013,2012,2011,2010,2009,2008,2007,2006,2005,2004,2003,2002,2001,2000,1999,1998,1997,1996,1995,1994,1993,1992,1991,1990,1989,1988,1987,1986,1985,1984,1983,1982,1981,1980,1979,1978,1977,1976,1975,1974,1973,1972,1971,1970,1969,1968,1967,1966,1965,1964,1963,1962,1961
Cette statistique dans les autres pays:
AfghanistanAlbaniaAlgeriaAndorraAngolaAntigua and BarbudaArgentinaArmeniaArubaAustraliaAustriaAzerbaijanBahamas, TheBahrainBangladeshBarbadosBelarusBelgiumBelizeBeninBermudaBhutanBoliviaBosnia and HerzegovinaBotswanaBrazilBrunei DarussalamBulgariaBurkina FasoBurundiCabo VerdeCambodiaCameroonCanadaCayman IslandsCentral African RepublicChadChannel IslandsChileChinaColombiaComorosCongo, Dem. Rep.Congo, Rep.Costa RicaCote d'IvoireCroatiaCubaCyprusCzech RepublicDenmarkDjiboutiDominicaDominican RepublicEcuadorEgypt, Arab Rep.El SalvadorEquatorial GuineaEritreaEstoniaEthiopiaFijiFinlandFranceFrench PolynesiaGabonGambia, TheGeorgiaGermanyGhanaGreeceGreenlandGrenadaGuatemalaGuineaGuinea-BissauGuyanaHaitiHondurasHong Kong SAR, ChinaHungaryIcelandIndiaIndonesiaIran, Islamic Rep.IraqIrelandIsle of ManIsraelItalyJamaicaJapanJordanKazakhstanKenyaKiribatiKorea, Rep.KosovoKuwaitKyrgyz RepublicLao PDRLatviaLebanonLesothoLiberiaLibyaLiechtensteinLithuaniaLuxembourgMacao SAR, ChinaMacedonia, FYRMadagascarMalawiMalaysiaMaldivesMaliMaltaMarshall IslandsMauritaniaMauritiusMexicoMicronesia, Fed. Sts.MoldovaMonacoMongoliaMontenegroMoroccoMozambiqueMyanmarNamibiaNauruNepalNetherlandsNew CaledoniaNew ZealandNicaraguaNigerNigeriaNorwayOmanPakistanPalauPanamaPapua New GuineaParaguayPeruPhilippinesPolandPortugalPuerto RicoQatarRomaniaRussian FederationRwandaSamoaSan MarinoSao Tome and PrincipeSaudi ArabiaSenegalSerbiaSeychellesSierra LeoneSingaporeSlovak RepublicSloveniaSolomon IslandsSomaliaSouth AfricaSouth SudanSpainSri LankaSt. Kitts and NevisSt. LuciaSt. Vincent and the GrenadinesSudanSurinameSwazilandSwedenSwitzerlandSyrian Arab RepublicTajikistanTanzaniaThailandTimor-LesteTogoTongaTrinidad and TobagoTunisiaTurkeyTurkmenistanTuvaluUgandaUkraineUnited Arab EmiratesUnited KingdomUnited StatesUruguayUzbekistanVanuatuVenezuela, RBVietnamVirgin Islands (U.S.)West Bank and GazaYemen, Rep.ZambiaZimbabwe La ligne de temps
Cette échelle de temps montre un graphique de 1961 année à 2016 année Benin. Les données jusqu'à 1960 année ne sont pas présentés. Quantité d'observations actuelles selon dates: 56.
Source (désignation):
Les indicateurs du développement mondiale
Source (organisation):
World Bank national accounts data, and OECD National Accounts data files.
Catégories:
Economy & Growth
Dernière mise à jour
23 avr. 2017
Les indicateurs de changement de valeurs selon les années
Minimum:
9.743
1 janv. 1961
Maximum:
124.719
1 janv. 2014
Pour la date d''observation
Valeur
Changement absolu
Le changement par rapport à la valeur précédente
1 janv. 1961
9.743
+9.743
0.0%
1 janv. 1962
9.844
+0.101
1.04%
1 janv. 1963
10.216
+0.372
3.78%
1 janv. 1964
10.477
+0.26
2.55%
1 janv. 1965
10.439
-0.038
-0.36%
1 janv. 1966
10.654
+0.215
2.06%
1 janv. 1967
10.775
+0.121
1.14%
1 janv. 1968
10.79
+0.015
0.14%
1 janv. 1969
11.143
+0.353
3.27%
1 janv. 1970
11.528
+0.385
3.45%
1 janv. 1971
12.11
+0.582
5.05%
1 janv. 1972
12.3
+0.191
1.57%
1 janv. 1973
12.954
+0.654
5.32%
1 janv. 1974
13.579
+0.625
4.82%
1 janv. 1975
15.605
+2.026
14.92%
1 janv. 1976
17.829
+2.223
14.25%
1 janv. 1977
20.331
+2.502
14.04%
1 janv. 1978
21.383
+1.053
5.18%
1 janv. 1979
24.021
+2.638
12.33%
1 janv. 1980
27.145
+3.124
13.0%
1 janv. 1981
29.91
+2.765
10.19%
1 janv. 1982
32.144
+2.234
7.47%
1 janv. 1983
37.335
+5.191
16.15%
1 janv. 1984
39.107
+1.772
4.75%
1 janv. 1985
39.871
+0.764
1.95%
1 janv. 1986
37.926
-1.944
-4.88%
1 janv. 1987
36.559
-1.367
-3.6%
1 janv. 1988
37.667
+1.107
3.03%
1 janv. 1989
37.437
-0.23
-0.61%
1 janv. 1990
38.27
+0.833
2.22%
1 janv. 1991
39.103
+0.833
2.18%
1 janv. 1992
39.398
+0.296
0.76%
1 janv. 1993
40.59
+1.192
3.03%
1 janv. 1994
41.556
+0.965
2.38%
1 janv. 1995
56.113
+14.557
35.03%
1 janv. 1996
64.585
+8.473
15.1%
1 janv. 1997
69.046
+4.461
6.91%
1 janv. 1998
71.579
+2.532
3.67%
1 janv. 1999
75.323
+3.745
5.23%
1 janv. 2000
81.758
+6.435
8.54%
1 janv. 2001
85.305
+3.547
4.34%
1 janv. 2002
86.988
+1.682
1.97%
1 janv. 2003
90.078
+3.091
3.55%
1 janv. 2004
92.838
+2.76
3.06%
1 janv. 2005
93.553
+0.715
0.77%
1 janv. 2006
97.57
+4.017
4.29%
1 janv. 2007
99.611
+2.041
2.09%
1 janv. 2008
100.0
+0.389
0.39%
1 janv. 2009
106.435
+6.435
6.43%
1 janv. 2010
109.138
+2.704
2.54%
1 janv. 2011
110.097
+0.959
0.88%
1 janv. 2012
114.208
+4.111
3.73%
1 janv. 2013
123.001
+8.793
7.7%
1 janv. 2014
124.719
+1.718
1.4%
1 janv. 2015
124.41
-0.309
-0.25%
1 janv. 2016
124.504
+0.093
0.08%
Classement des pays selon les statistiques actuelles par années


Commentaires: