29
/fr/
fr
AIzaSyAYiBZKx7MnpbEhh9jyipgxe19OcubqV5w
April 1, 2024
262239
Thailand
THA
true
2
1
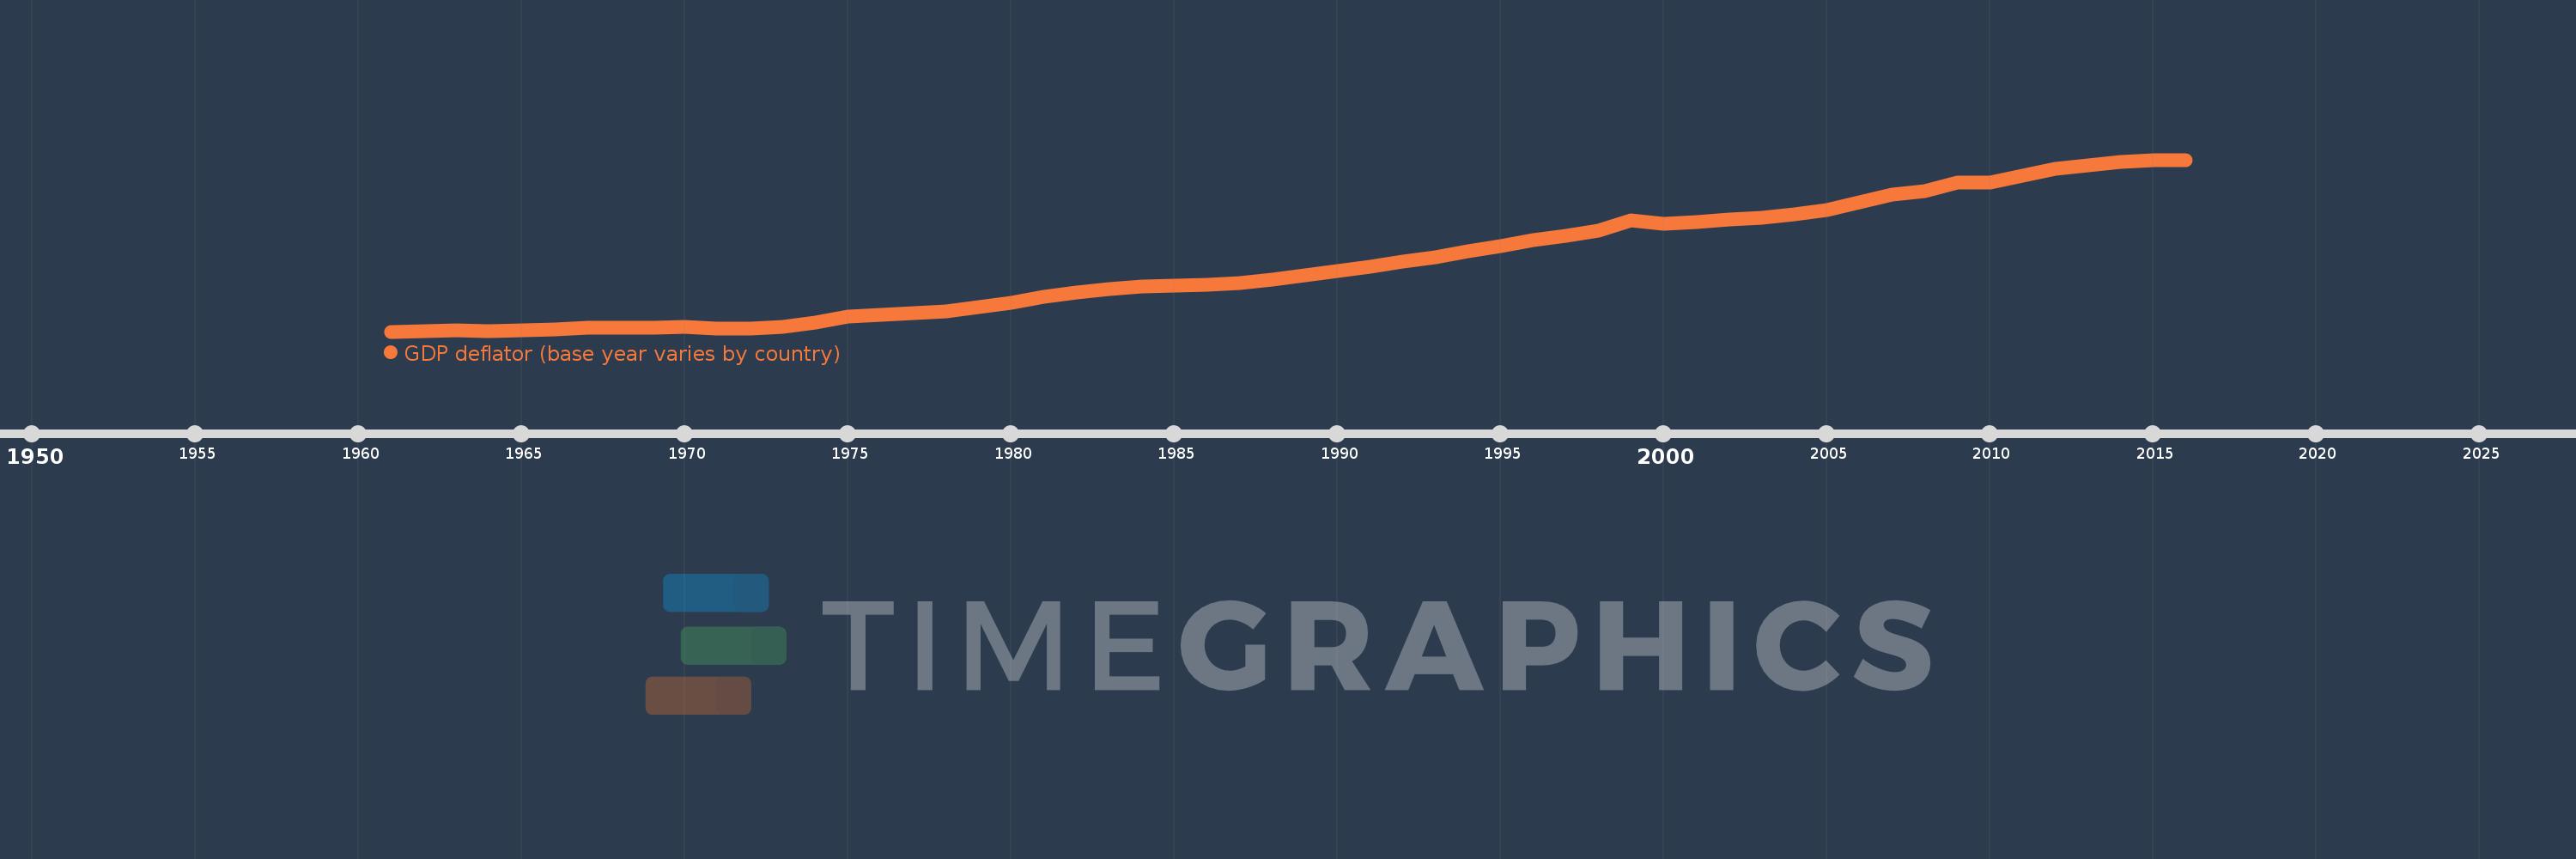
GDP deflator (base year varies by country)
2016,2015,2014,2013,2012,2011,2010,2009,2008,2007,2006,2005,2004,2003,2002,2001,2000,1999,1998,1997,1996,1995,1994,1993,1992,1991,1990,1989,1988,1987,1986,1985,1984,1983,1982,1981,1980,1979,1978,1977,1976,1975,1974,1973,1972,1971,1970,1969,1968,1967,1966,1965,1964,1963,1962,1961
Cette statistique dans les autres pays:
AfghanistanAlbaniaAlgeriaAndorraAngolaAntigua and BarbudaArgentinaArmeniaArubaAustraliaAustriaAzerbaijanBahamas, TheBahrainBangladeshBarbadosBelarusBelgiumBelizeBeninBermudaBhutanBoliviaBosnia and HerzegovinaBotswanaBrazilBrunei DarussalamBulgariaBurkina FasoBurundiCabo VerdeCambodiaCameroonCanadaCayman IslandsCentral African RepublicChadChannel IslandsChileChinaColombiaComorosCongo, Dem. Rep.Congo, Rep.Costa RicaCote d'IvoireCroatiaCubaCyprusCzech RepublicDenmarkDjiboutiDominicaDominican RepublicEcuadorEgypt, Arab Rep.El SalvadorEquatorial GuineaEritreaEstoniaEthiopiaFijiFinlandFranceFrench PolynesiaGabonGambia, TheGeorgiaGermanyGhanaGreeceGreenlandGrenadaGuatemalaGuineaGuinea-BissauGuyanaHaitiHondurasHong Kong SAR, ChinaHungaryIcelandIndiaIndonesiaIran, Islamic Rep.IraqIrelandIsle of ManIsraelItalyJamaicaJapanJordanKazakhstanKenyaKiribatiKorea, Rep.KosovoKuwaitKyrgyz RepublicLao PDRLatviaLebanonLesothoLiberiaLibyaLiechtensteinLithuaniaLuxembourgMacao SAR, ChinaMacedonia, FYRMadagascarMalawiMalaysiaMaldivesMaliMaltaMarshall IslandsMauritaniaMauritiusMexicoMicronesia, Fed. Sts.MoldovaMonacoMongoliaMontenegroMoroccoMozambiqueMyanmarNamibiaNauruNepalNetherlandsNew CaledoniaNew ZealandNicaraguaNigerNigeriaNorwayOmanPakistanPalauPanamaPapua New GuineaParaguayPeruPhilippinesPolandPortugalPuerto RicoQatarRomaniaRussian FederationRwandaSamoaSan MarinoSao Tome and PrincipeSaudi ArabiaSenegalSerbiaSeychellesSierra LeoneSingaporeSlovak RepublicSloveniaSolomon IslandsSomaliaSouth AfricaSouth SudanSpainSri LankaSt. Kitts and NevisSt. LuciaSt. Vincent and the GrenadinesSudanSurinameSwazilandSwedenSwitzerlandSyrian Arab RepublicTajikistanTanzaniaThailandTimor-LesteTogoTongaTrinidad and TobagoTunisiaTurkeyTurkmenistanTuvaluUgandaUkraineUnited Arab EmiratesUnited KingdomUnited StatesUruguayUzbekistanVanuatuVenezuela, RBVietnamVirgin Islands (U.S.)West Bank and GazaYemen, Rep.ZambiaZimbabwe La ligne de temps
Cette échelle de temps montre un graphique de 1961 année à 2016 année Thailand. Les données jusqu'à 1960 année ne sont pas présentés. Quantité d'observations actuelles selon dates: 56.
Source (désignation):
Les indicateurs du développement mondiale
Source (organisation):
World Bank national accounts data, and OECD National Accounts data files.
Catégories:
Economy & Growth
Dernière mise à jour
23 avr. 2017
Les indicateurs de changement de valeurs selon les années
Minimum:
15.492
1 janv. 1961
Maximum:
142.879
1 janv. 2016
Pour la date d''observation
Valeur
Changement absolu
Le changement par rapport à la valeur précédente
1 janv. 1961
15.492
+15.492
0.0%
1 janv. 1962
16.065
+0.573
3.7%
1 janv. 1963
16.152
+0.087
0.54%
1 janv. 1964
15.964
-0.188
-1.17%
1 janv. 1965
16.391
+0.427
2.68%
1 janv. 1966
17.099
+0.708
4.32%
1 janv. 1967
18.509
+1.41
8.25%
1 janv. 1968
18.2
-0.309
-1.67%
1 janv. 1969
18.154
-0.046
-0.25%
1 janv. 1970
18.759
+0.605
3.33%
1 janv. 1971
17.822
-0.937
-5.0%
1 janv. 1972
17.682
-0.14
-0.79%
1 janv. 1973
18.802
+1.12
6.34%
1 janv. 1974
22.271
+3.468
18.45%
1 janv. 1975
26.799
+4.529
20.33%
1 janv. 1976
27.734
+0.935
3.49%
1 janv. 1977
28.981
+1.247
4.5%
1 janv. 1978
30.724
+1.743
6.01%
1 janv. 1979
33.704
+2.979
9.7%
1 janv. 1980
36.618
+2.914
8.65%
1 janv. 1981
41.269
+4.651
12.7%
1 janv. 1982
44.724
+3.455
8.37%
1 janv. 1983
46.986
+2.262
5.06%
1 janv. 1984
48.701
+1.715
3.65%
1 janv. 1985
49.406
+0.705
1.45%
1 janv. 1986
50.482
+1.076
2.18%
1 janv. 1987
51.316
+0.835
1.65%
1 janv. 1988
53.74
+2.424
4.72%
1 janv. 1989
56.92
+3.181
5.92%
1 janv. 1990
60.402
+3.482
6.12%
1 janv. 1991
63.889
+3.487
5.77%
1 janv. 1992
67.561
+3.671
5.75%
1 janv. 1993
70.594
+3.034
4.49%
1 janv. 1994
75.177
+4.583
6.49%
1 janv. 1995
78.69
+3.513
4.67%
1 janv. 1996
83.207
+4.517
5.74%
1 janv. 1997
86.617
+3.41
4.1%
1 janv. 1998
90.446
+3.829
4.42%
1 janv. 1999
97.739
+7.293
8.06%
1 janv. 2000
95.22
-2.519
-2.58%
1 janv. 2001
96.487
+1.267
1.33%
1 janv. 2002
98.338
+1.85
1.92%
1 janv. 2003
100.0
+1.662
1.69%
1 janv. 2004
102.149
+2.149
2.15%
1 janv. 2005
105.795
+3.646
3.57%
1 janv. 2006
111.182
+5.387
5.09%
1 janv. 2007
116.857
+5.675
5.1%
1 janv. 2008
119.747
+2.89
2.47%
1 janv. 2009
125.895
+6.148
5.13%
1 janv. 2010
126.14
+0.245
0.19%
1 janv. 2011
131.289
+5.149
4.08%
1 janv. 2012
136.207
+4.918
3.75%
1 janv. 2013
138.808
+2.601
1.91%
1 janv. 2014
141.203
+2.395
1.73%
1 janv. 2015
142.562
+1.36
0.96%
1 janv. 2016
142.879
+0.316
0.22%
Classement des pays selon les statistiques actuelles par années


Commentaires: