29
/fr/
fr
AIzaSyAYiBZKx7MnpbEhh9jyipgxe19OcubqV5w
April 1, 2024
191398
Malta
MLT
true
2
1
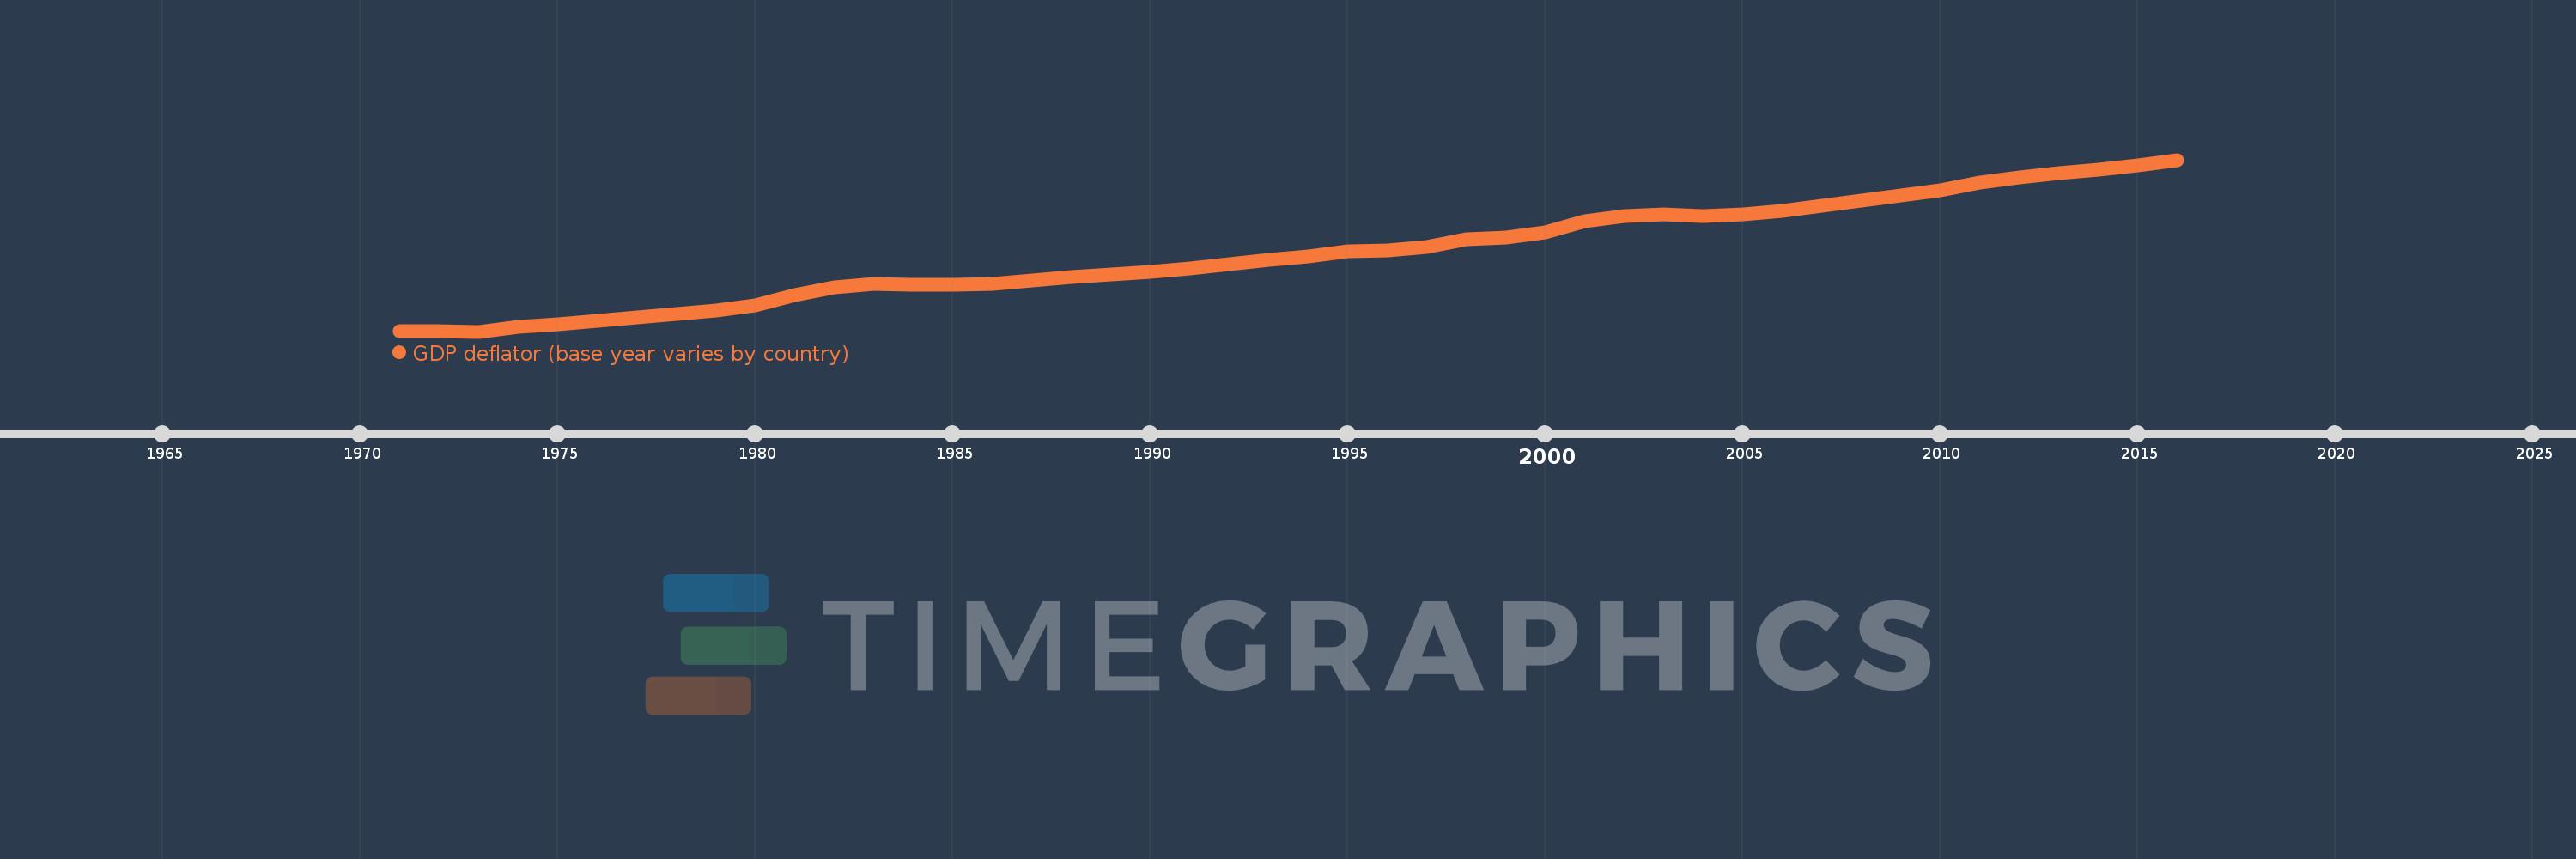
GDP deflator (base year varies by country)
2016,2015,2014,2013,2012,2011,2010,2009,2008,2007,2006,2005,2004,2003,2002,2001,2000,1999,1998,1997,1996,1995,1994,1993,1992,1991,1990,1989,1988,1987,1986,1985,1984,1983,1982,1981,1980,1979,1978,1977,1976,1975,1974,1973,1972,1971
Cette statistique dans les autres pays:
AfghanistanAlbaniaAlgeriaAndorraAngolaAntigua and BarbudaArgentinaArmeniaArubaAustraliaAustriaAzerbaijanBahamas, TheBahrainBangladeshBarbadosBelarusBelgiumBelizeBeninBermudaBhutanBoliviaBosnia and HerzegovinaBotswanaBrazilBrunei DarussalamBulgariaBurkina FasoBurundiCabo VerdeCambodiaCameroonCanadaCayman IslandsCentral African RepublicChadChannel IslandsChileChinaColombiaComorosCongo, Dem. Rep.Congo, Rep.Costa RicaCote d'IvoireCroatiaCubaCyprusCzech RepublicDenmarkDjiboutiDominicaDominican RepublicEcuadorEgypt, Arab Rep.El SalvadorEquatorial GuineaEritreaEstoniaEthiopiaFijiFinlandFranceFrench PolynesiaGabonGambia, TheGeorgiaGermanyGhanaGreeceGreenlandGrenadaGuatemalaGuineaGuinea-BissauGuyanaHaitiHondurasHong Kong SAR, ChinaHungaryIcelandIndiaIndonesiaIran, Islamic Rep.IraqIrelandIsle of ManIsraelItalyJamaicaJapanJordanKazakhstanKenyaKiribatiKorea, Rep.KosovoKuwaitKyrgyz RepublicLao PDRLatviaLebanonLesothoLiberiaLibyaLiechtensteinLithuaniaLuxembourgMacao SAR, ChinaMacedonia, FYRMadagascarMalawiMalaysiaMaldivesMaliMaltaMarshall IslandsMauritaniaMauritiusMexicoMicronesia, Fed. Sts.MoldovaMonacoMongoliaMontenegroMoroccoMozambiqueMyanmarNamibiaNauruNepalNetherlandsNew CaledoniaNew ZealandNicaraguaNigerNigeriaNorwayOmanPakistanPalauPanamaPapua New GuineaParaguayPeruPhilippinesPolandPortugalPuerto RicoQatarRomaniaRussian FederationRwandaSamoaSan MarinoSao Tome and PrincipeSaudi ArabiaSenegalSerbiaSeychellesSierra LeoneSingaporeSlovak RepublicSloveniaSolomon IslandsSomaliaSouth AfricaSouth SudanSpainSri LankaSt. Kitts and NevisSt. LuciaSt. Vincent and the GrenadinesSudanSurinameSwazilandSwedenSwitzerlandSyrian Arab RepublicTajikistanTanzaniaThailandTimor-LesteTogoTongaTrinidad and TobagoTunisiaTurkeyTurkmenistanTuvaluUgandaUkraineUnited Arab EmiratesUnited KingdomUnited StatesUruguayUzbekistanVanuatuVenezuela, RBVietnamVirgin Islands (U.S.)West Bank and GazaYemen, Rep.ZambiaZimbabwe La ligne de temps
Cette échelle de temps montre un graphique de 1971 année à 2016 année Malta. Les données jusqu'à 1970 année ne sont pas présentés. Quantité d'observations actuelles selon dates: 46.
Source (désignation):
Les indicateurs du développement mondiale
Source (organisation):
World Bank national accounts data, and OECD National Accounts data files.
Catégories:
Economy & Growth
Dernière mise à jour
23 avr. 2017
Les indicateurs de changement de valeurs selon les années
Minimum:
28.284
1 janv. 1973
Maximum:
110.822
1 janv. 2016
Pour la date d''observation
Valeur
Changement absolu
Le changement par rapport à la valeur précédente
1 janv. 1971
28.454
+28.454
0.0%
1 janv. 1972
28.634
+0.18
0.63%
1 janv. 1973
28.284
-0.35
-1.22%
1 janv. 1974
30.741
+2.457
8.69%
1 janv. 1975
31.775
+1.034
3.36%
1 janv. 1976
33.479
+1.704
5.36%
1 janv. 1977
35.162
+1.683
5.03%
1 janv. 1978
36.892
+1.73
4.92%
1 janv. 1979
38.425
+1.533
4.15%
1 janv. 1980
40.81
+2.385
6.21%
1 janv. 1981
45.868
+5.057
12.39%
1 janv. 1982
49.436
+3.569
7.78%
1 janv. 1983
51.138
+1.701
3.44%
1 janv. 1984
50.981
-0.156
-0.31%
1 janv. 1985
50.891
-0.09
-0.18%
1 janv. 1986
51.215
+0.324
0.64%
1 janv. 1987
53.017
+1.802
3.52%
1 janv. 1988
54.635
+1.618
3.05%
1 janv. 1989
55.651
+1.016
1.86%
1 janv. 1990
56.846
+1.195
2.15%
1 janv. 1991
58.637
+1.791
3.15%
1 janv. 1992
60.602
+1.965
3.35%
1 janv. 1993
62.756
+2.154
3.55%
1 janv. 1994
64.547
+1.791
2.85%
1 janv. 1995
66.846
+2.299
3.56%
1 janv. 1996
67.368
+0.522
0.78%
1 janv. 1997
68.785
+1.417
2.1%
1 janv. 1998
72.629
+3.844
5.59%
1 janv. 1999
73.629
+1.0
1.38%
1 janv. 2000
75.947
+2.317
3.15%
1 janv. 2001
81.514
+5.567
7.33%
1 janv. 2002
83.716
+2.202
2.7%
1 janv. 2003
84.802
+1.086
1.3%
1 janv. 2004
83.702
-1.1
-1.3%
1 janv. 2005
84.593
+0.891
1.06%
1 janv. 2006
86.112
+1.52
1.8%
1 janv. 2007
88.578
+2.466
2.86%
1 janv. 2008
91.056
+2.478
2.8%
1 janv. 2009
93.788
+2.732
3.0%
1 janv. 2010
96.311
+2.523
2.69%
1 janv. 2011
100.0
+3.689
3.83%
1 janv. 2012
102.308
+2.308
2.31%
1 janv. 2013
104.303
+1.995
1.95%
1 janv. 2014
106.243
+1.94
1.86%
1 janv. 2015
108.333
+2.09
1.97%
1 janv. 2016
110.822
+2.489
2.3%
Classement des pays selon les statistiques actuelles par années


Commentaires: