29
/fr/
fr
AIzaSyAYiBZKx7MnpbEhh9jyipgxe19OcubqV5w
April 1, 2024
81556
Belgium
BEL
true
2
1
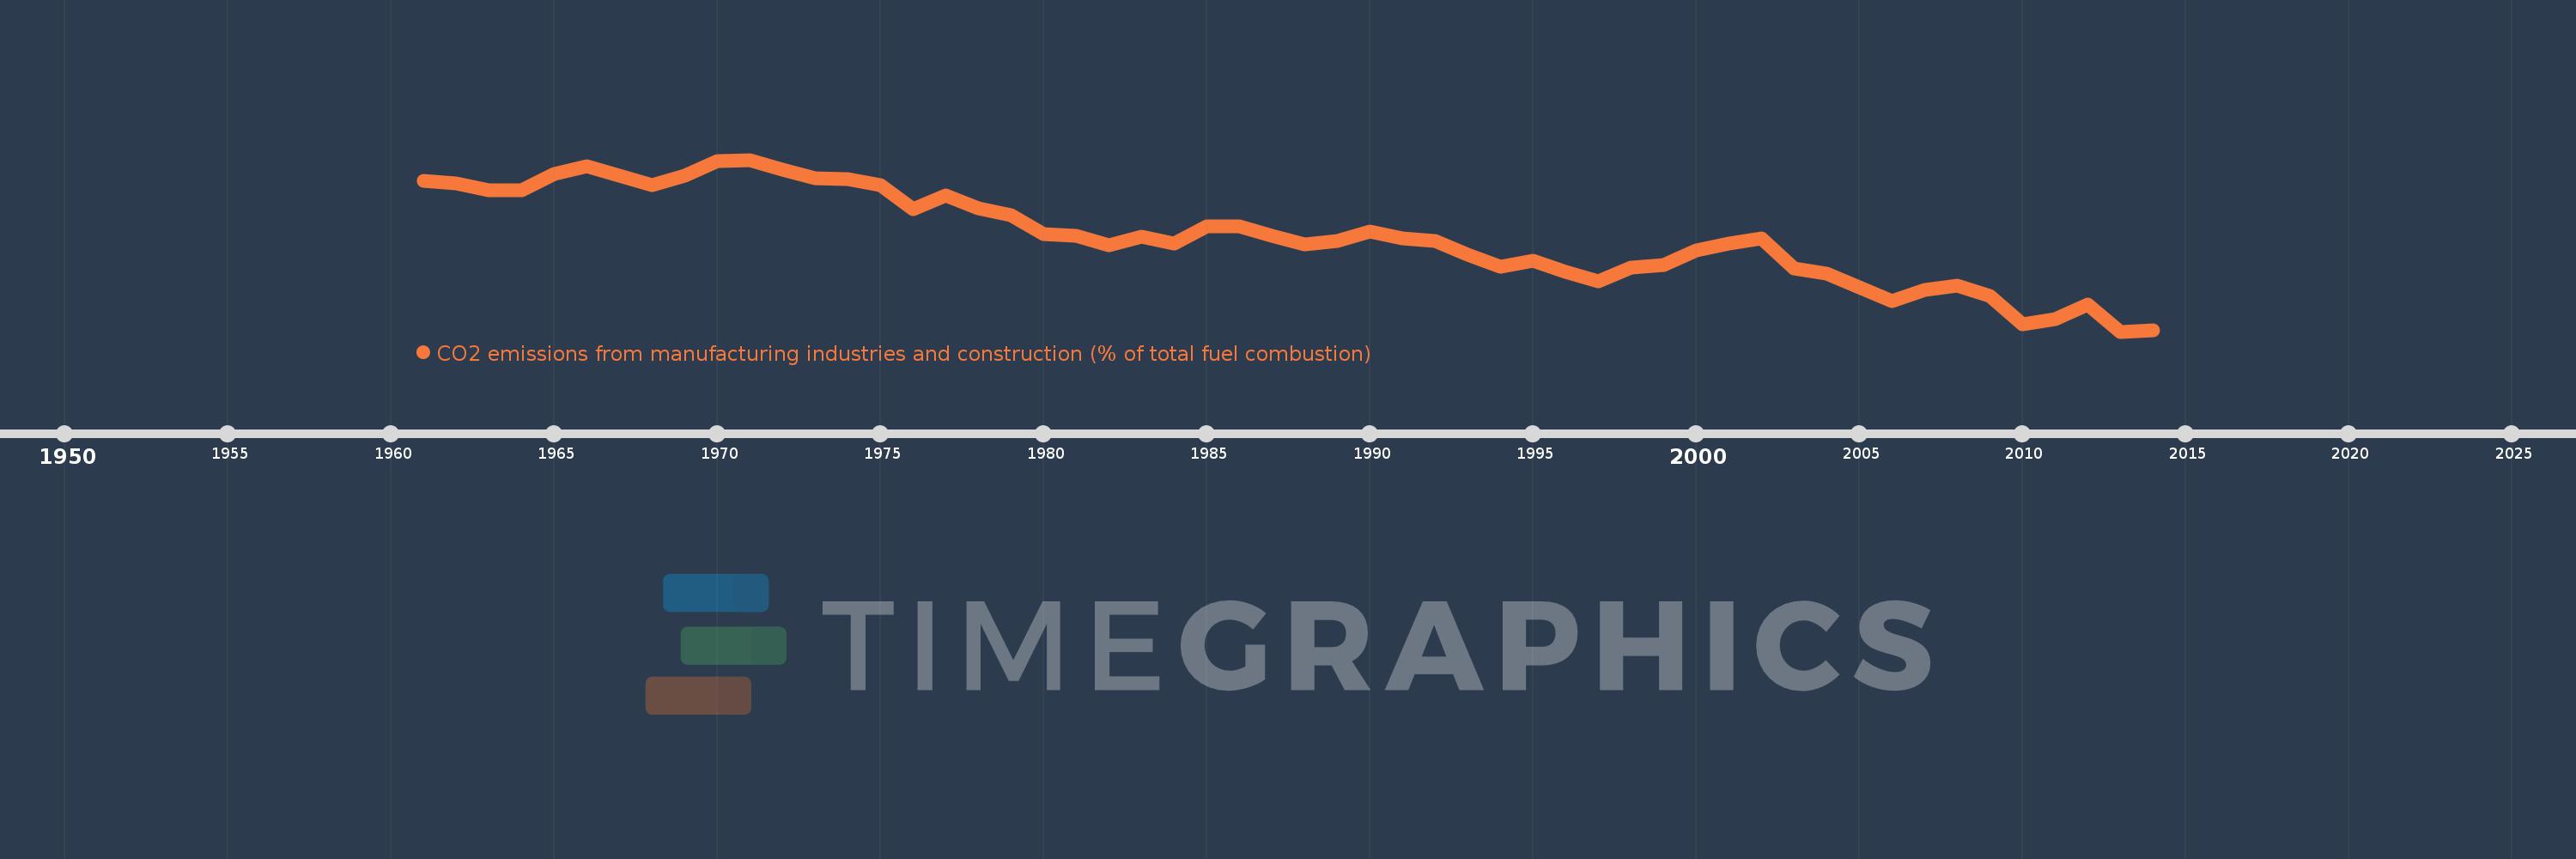
CO2 emissions from manufacturing industries and construction (% of total fuel combustion)
2014,2013,2012,2011,2010,2009,2008,2007,2006,2005,2004,2003,2002,2001,2000,1999,1998,1997,1996,1995,1994,1993,1992,1991,1990,1989,1988,1987,1986,1985,1984,1983,1982,1981,1980,1979,1978,1977,1976,1975,1974,1973,1972,1971,1970,1969,1968,1967,1966,1965,1964,1963,1962,1961
Cette statistique dans les autres pays:
AlbaniaAlgeriaAngolaArab WorldArgentinaArmeniaAustraliaAustriaAzerbaijanBahrainBangladeshBelarusBelgiumBeninBoliviaBosnia and HerzegovinaBotswanaBrazilBrunei DarussalamBulgariaCambodiaCameroonCanadaCaribbean small statesCentral Europe and the BalticsChileChinaColombiaCongo, Dem. Rep.Congo, Rep.Costa RicaCote d'IvoireCroatiaCubaCuracaoCyprusCzech RepublicDenmarkDominican RepublicEarly-demographic dividendEast Asia & PacificEast Asia & Pacific (excluding high income)East Asia & Pacific (IDA & IBRD countries)EcuadorEgypt, Arab Rep.El SalvadorEritreaEstoniaEthiopiaEuro areaEurope & Central AsiaEurope & Central Asia (excluding high income)Europe & Central Asia (IDA & IBRD countries)European UnionFinlandFragile and conflict affected situationsFranceGabonGeorgiaGermanyGhanaGibraltarGreeceGuatemalaHaitiHeavily indebted poor countries (HIPC)High incomeHondurasHong Kong SAR, ChinaHungaryIBRD onlyIcelandIDA & IBRD totalIDA blendIDA onlyIDA totalIndiaIndonesiaIran, Islamic Rep.IraqIrelandIsraelItalyJamaicaJapanJordanKazakhstanKenyaKorea, Dem. People’s Rep.Korea, Rep.KosovoKuwaitKyrgyz RepublicLate-demographic dividendLatin America & Caribbean Latin America & Caribbean (excluding high income)Latin America & the Caribbean (IDA & IBRD countries)LatviaLeast developed countries: UN classificationLebanonLibyaLithuaniaLow & middle incomeLow incomeLower middle incomeLuxembourgMacedonia, FYRMalaysiaMaltaMauritiusMexicoMiddle East & North AfricaMiddle East & North Africa (excluding high income)Middle East & North Africa (IDA & IBRD countries)Middle incomeMoldovaMongoliaMontenegroMoroccoMozambiqueMyanmarNamibiaNepalNetherlandsNew ZealandNicaraguaNigerNigeriaNorth AmericaNorwayOECD membersOmanOther small statesPakistanPanamaParaguayPeruPhilippinesPolandPortugalPost-demographic dividendPre-demographic dividendQatarRomaniaRussian FederationSaudi ArabiaSenegalSerbiaSingaporeSlovak RepublicSloveniaSmall statesSouth AfricaSouth AsiaSouth Asia (IDA & IBRD)South SudanSpainSri LankaSub-Saharan Africa Sub-Saharan Africa (excluding high income)Sub-Saharan Africa (IDA & IBRD countries)SudanSwedenSwitzerlandSyrian Arab RepublicTajikistanTanzaniaThailandTogoTrinidad and TobagoTunisiaTurkeyTurkmenistanUkraineUnited Arab EmiratesUnited KingdomUnited StatesUpper middle incomeUruguayUzbekistanVenezuela, RBVietnamWorldYemen, Rep.ZambiaZimbabwe La ligne de temps
Cette échelle de temps montre un graphique de 1961 année à 2014 année Belgium. Les données jusqu'à 1960 année ne sont pas présentés. Quantité d'observations actuelles selon dates: 54.
Source (désignation):
Les indicateurs du développement mondiale
Source (organisation):
IEA Statistics © OECD/IEA 2014 (http://www.iea.org/stats/index.asp), subject to https://www.iea.org/t&c/termsandconditions/
Catégories:
Environment
Dernière mise à jour
23 avr. 2017
Les indicateurs de changement de valeurs selon les années
Minimum:
15.348
1 janv. 2013
Maximum:
35.803
1 janv. 1971
Pour la date d''observation
Valeur
Changement absolu
Le changement par rapport à la valeur précédente
1 janv. 1961
33.265
+33.265
0.0%
1 janv. 1962
32.984
-0.281
-0.85%
1 janv. 1963
32.134
-0.85
-2.58%
1 janv. 1964
32.195
+0.061
0.19%
1 janv. 1965
34.117
+1.923
5.97%
1 janv. 1966
34.991
+0.873
2.56%
1 janv. 1967
33.938
-1.053
-3.01%
1 janv. 1968
32.773
-1.165
-3.43%
1 janv. 1969
33.868
+1.095
3.34%
1 janv. 1970
35.611
+1.744
5.15%
1 janv. 1971
35.803
+0.192
0.54%
1 janv. 1972
34.676
-1.127
-3.15%
1 janv. 1973
33.633
-1.043
-3.01%
1 janv. 1974
33.476
-0.157
-0.47%
1 janv. 1975
32.765
-0.711
-2.12%
1 janv. 1976
29.879
-2.887
-8.81%
1 janv. 1977
31.511
+1.633
5.46%
1 janv. 1978
29.975
-1.536
-4.88%
1 janv. 1979
29.159
-0.816
-2.72%
1 janv. 1980
26.998
-2.161
-7.41%
1 janv. 1981
26.733
-0.265
-0.98%
1 janv. 1982
25.672
-1.062
-3.97%
1 janv. 1983
26.634
+0.962
3.75%
1 janv. 1984
25.796
-0.838
-3.15%
1 janv. 1985
27.907
+2.111
8.18%
1 janv. 1986
27.845
-0.061
-0.22%
1 janv. 1987
26.798
-1.048
-3.76%
1 janv. 1988
25.745
-1.052
-3.93%
1 janv. 1989
26.177
+0.432
1.68%
1 janv. 1990
27.295
+1.118
4.27%
1 janv. 1991
26.466
-0.829
-3.04%
1 janv. 1992
26.154
-0.312
-1.18%
1 janv. 1993
24.519
-1.635
-6.25%
1 janv. 1994
23.028
-1.491
-6.08%
1 janv. 1995
23.778
+0.75
3.26%
1 janv. 1996
22.422
-1.356
-5.7%
1 janv. 1997
21.317
-1.106
-4.93%
1 janv. 1998
22.978
+1.662
7.79%
1 janv. 1999
23.283
+0.305
1.33%
1 janv. 2000
25.02
+1.737
7.46%
1 janv. 2001
25.798
+0.778
3.11%
1 janv. 2002
26.422
+0.624
2.42%
1 janv. 2003
22.863
-3.559
-13.47%
1 janv. 2004
22.254
-0.609
-2.66%
1 janv. 2005
20.578
-1.676
-7.53%
1 janv. 2006
18.966
-1.612
-7.83%
1 janv. 2007
20.33
+1.364
7.19%
1 janv. 2008
20.834
+0.504
2.48%
1 janv. 2009
19.552
-1.282
-6.15%
1 janv. 2010
16.223
-3.329
-17.03%
1 janv. 2011
16.881
+0.658
4.06%
1 janv. 2012
18.551
+1.671
9.9%
1 janv. 2013
15.348
-3.203
-17.27%
1 janv. 2014
15.543
+0.194
1.27%
Classement des pays selon les statistiques actuelles par années


Commentaires: