29
/fr/
fr
AIzaSyAYiBZKx7MnpbEhh9jyipgxe19OcubqV5w
April 1, 2024
195301
Mexico
MEX
true
2
1
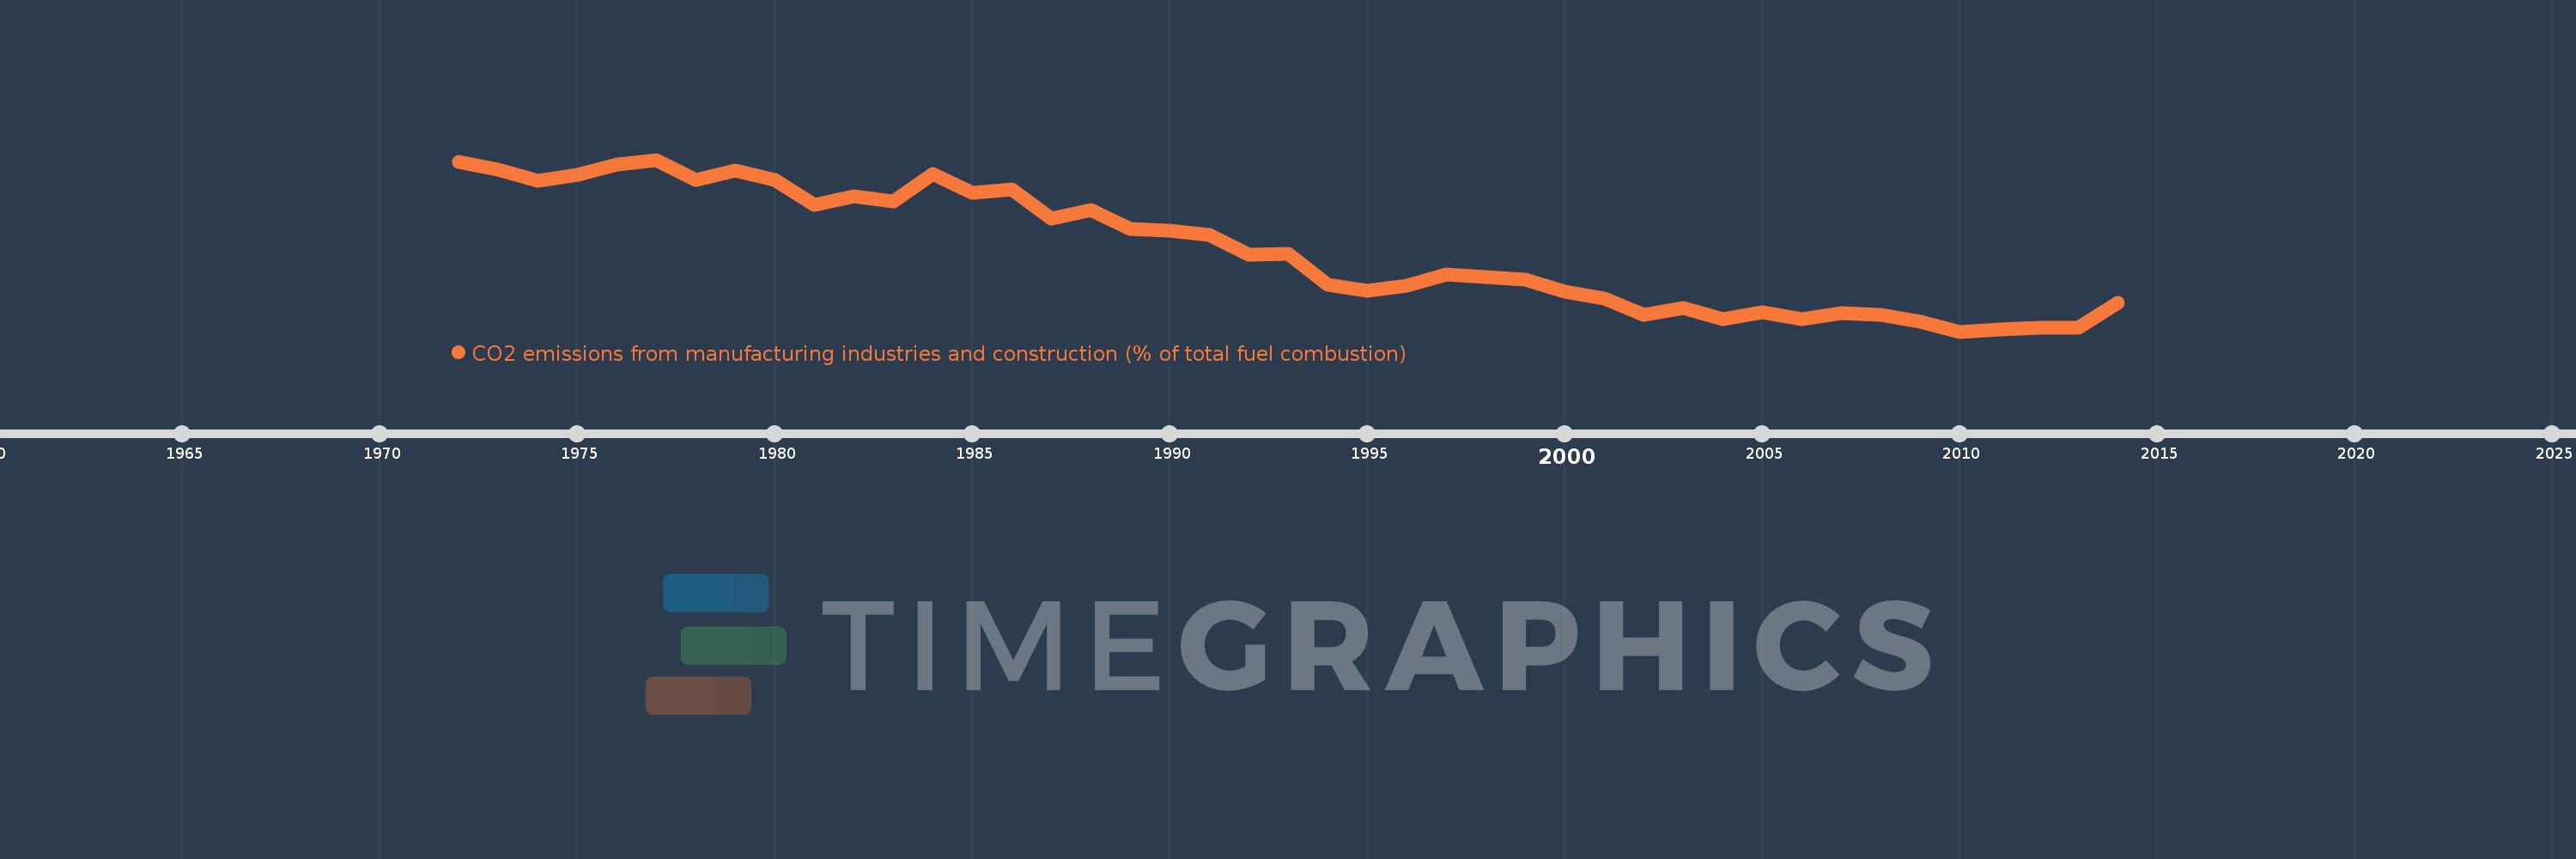
CO2 emissions from manufacturing industries and construction (% of total fuel combustion)
2014,2013,2012,2011,2010,2009,2008,2007,2006,2005,2004,2003,2002,2001,2000,1999,1998,1997,1996,1995,1994,1993,1992,1991,1990,1989,1988,1987,1986,1985,1984,1983,1982,1981,1980,1979,1978,1977,1976,1975,1974,1973,1972
Cette statistique dans les autres pays:
AlbaniaAlgeriaAngolaArab WorldArgentinaArmeniaAustraliaAustriaAzerbaijanBahrainBangladeshBelarusBelgiumBeninBoliviaBosnia and HerzegovinaBotswanaBrazilBrunei DarussalamBulgariaCambodiaCameroonCanadaCaribbean small statesCentral Europe and the BalticsChileChinaColombiaCongo, Dem. Rep.Congo, Rep.Costa RicaCote d'IvoireCroatiaCubaCuracaoCyprusCzech RepublicDenmarkDominican RepublicEarly-demographic dividendEast Asia & PacificEast Asia & Pacific (excluding high income)East Asia & Pacific (IDA & IBRD countries)EcuadorEgypt, Arab Rep.El SalvadorEritreaEstoniaEthiopiaEuro areaEurope & Central AsiaEurope & Central Asia (excluding high income)Europe & Central Asia (IDA & IBRD countries)European UnionFinlandFragile and conflict affected situationsFranceGabonGeorgiaGermanyGhanaGibraltarGreeceGuatemalaHaitiHeavily indebted poor countries (HIPC)High incomeHondurasHong Kong SAR, ChinaHungaryIBRD onlyIcelandIDA & IBRD totalIDA blendIDA onlyIDA totalIndiaIndonesiaIran, Islamic Rep.IraqIrelandIsraelItalyJamaicaJapanJordanKazakhstanKenyaKorea, Dem. People’s Rep.Korea, Rep.KosovoKuwaitKyrgyz RepublicLate-demographic dividendLatin America & Caribbean Latin America & Caribbean (excluding high income)Latin America & the Caribbean (IDA & IBRD countries)LatviaLeast developed countries: UN classificationLebanonLibyaLithuaniaLow & middle incomeLow incomeLower middle incomeLuxembourgMacedonia, FYRMalaysiaMaltaMauritiusMexicoMiddle East & North AfricaMiddle East & North Africa (excluding high income)Middle East & North Africa (IDA & IBRD countries)Middle incomeMoldovaMongoliaMontenegroMoroccoMozambiqueMyanmarNamibiaNepalNetherlandsNew ZealandNicaraguaNigerNigeriaNorth AmericaNorwayOECD membersOmanOther small statesPakistanPanamaParaguayPeruPhilippinesPolandPortugalPost-demographic dividendPre-demographic dividendQatarRomaniaRussian FederationSaudi ArabiaSenegalSerbiaSingaporeSlovak RepublicSloveniaSmall statesSouth AfricaSouth AsiaSouth Asia (IDA & IBRD)South SudanSpainSri LankaSub-Saharan Africa Sub-Saharan Africa (excluding high income)Sub-Saharan Africa (IDA & IBRD countries)SudanSwedenSwitzerlandSyrian Arab RepublicTajikistanTanzaniaThailandTogoTrinidad and TobagoTunisiaTurkeyTurkmenistanUkraineUnited Arab EmiratesUnited KingdomUnited StatesUpper middle incomeUruguayUzbekistanVenezuela, RBVietnamWorldYemen, Rep.ZambiaZimbabwe La ligne de temps
Cette échelle de temps montre un graphique de 1972 année à 2014 année Mexico. Les données jusqu'à 1971 année ne sont pas présentés. Quantité d'observations actuelles selon dates: 43.
Source (désignation):
Les indicateurs du développement mondiale
Source (organisation):
IEA Statistics © OECD/IEA 2014 (http://www.iea.org/stats/index.asp), subject to https://www.iea.org/t&c/termsandconditions/
Catégories:
Environment
Dernière mise à jour
23 avr. 2017
Les indicateurs de changement de valeurs selon les années
Minimum:
11.523
1 janv. 2010
Maximum:
29.664
1 janv. 1977
Pour la date d''observation
Valeur
Changement absolu
Le changement par rapport à la valeur précédente
1 janv. 1972
29.481
+29.481
0.0%
1 janv. 1973
28.622
-0.859
-2.91%
1 janv. 1974
27.398
-1.224
-4.28%
1 janv. 1975
28.039
+0.641
2.34%
1 janv. 1976
29.141
+1.102
3.93%
1 janv. 1977
29.664
+0.523
1.8%
1 janv. 1978
27.518
-2.145
-7.23%
1 janv. 1979
28.504
+0.986
3.58%
1 janv. 1980
27.545
-0.959
-3.36%
1 janv. 1981
24.913
-2.632
-9.56%
1 janv. 1982
25.793
+0.88
3.53%
1 janv. 1983
25.31
-0.482
-1.87%
1 janv. 1984
28.19
+2.879
11.38%
1 janv. 1985
26.147
-2.043
-7.25%
1 janv. 1986
26.497
+0.351
1.34%
1 janv. 1987
23.414
-3.083
-11.64%
1 janv. 1988
24.322
+0.908
3.88%
1 janv. 1989
22.381
-1.942
-7.98%
1 janv. 1990
22.185
-0.196
-0.87%
1 janv. 1991
21.732
-0.452
-2.04%
1 janv. 1992
19.684
-2.049
-9.43%
1 janv. 1993
19.706
+0.022
0.11%
1 janv. 1994
16.501
-3.205
-16.26%
1 janv. 1995
15.868
-0.633
-3.84%
1 janv. 1996
16.369
+0.501
3.16%
1 janv. 1997
17.577
+1.207
7.38%
1 janv. 1998
17.245
-0.331
-1.89%
1 janv. 1999
17.056
-0.189
-1.1%
1 janv. 2000
15.772
-1.284
-7.53%
1 janv. 2001
15.012
-0.76
-4.82%
1 janv. 2002
13.309
-1.703
-11.35%
1 janv. 2003
14.044
+0.735
5.52%
1 janv. 2004
12.823
-1.221
-8.69%
1 janv. 2005
13.552
+0.729
5.69%
1 janv. 2006
12.88
-0.672
-4.96%
1 janv. 2007
13.433
+0.553
4.29%
1 janv. 2008
13.308
-0.126
-0.94%
1 janv. 2009
12.565
-0.742
-5.58%
1 janv. 2010
11.523
-1.043
-8.3%
1 janv. 2011
11.738
+0.215
1.87%
1 janv. 2012
11.911
+0.173
1.48%
1 janv. 2013
11.951
+0.04
0.33%
1 janv. 2014
14.572
+2.621
21.93%
Classement des pays selon les statistiques actuelles par années


Commentaires: