29
/fr/
fr
AIzaSyAYiBZKx7MnpbEhh9jyipgxe19OcubqV5w
April 1, 2024
47977
Middle East & North Africa
MEA
false
2
1
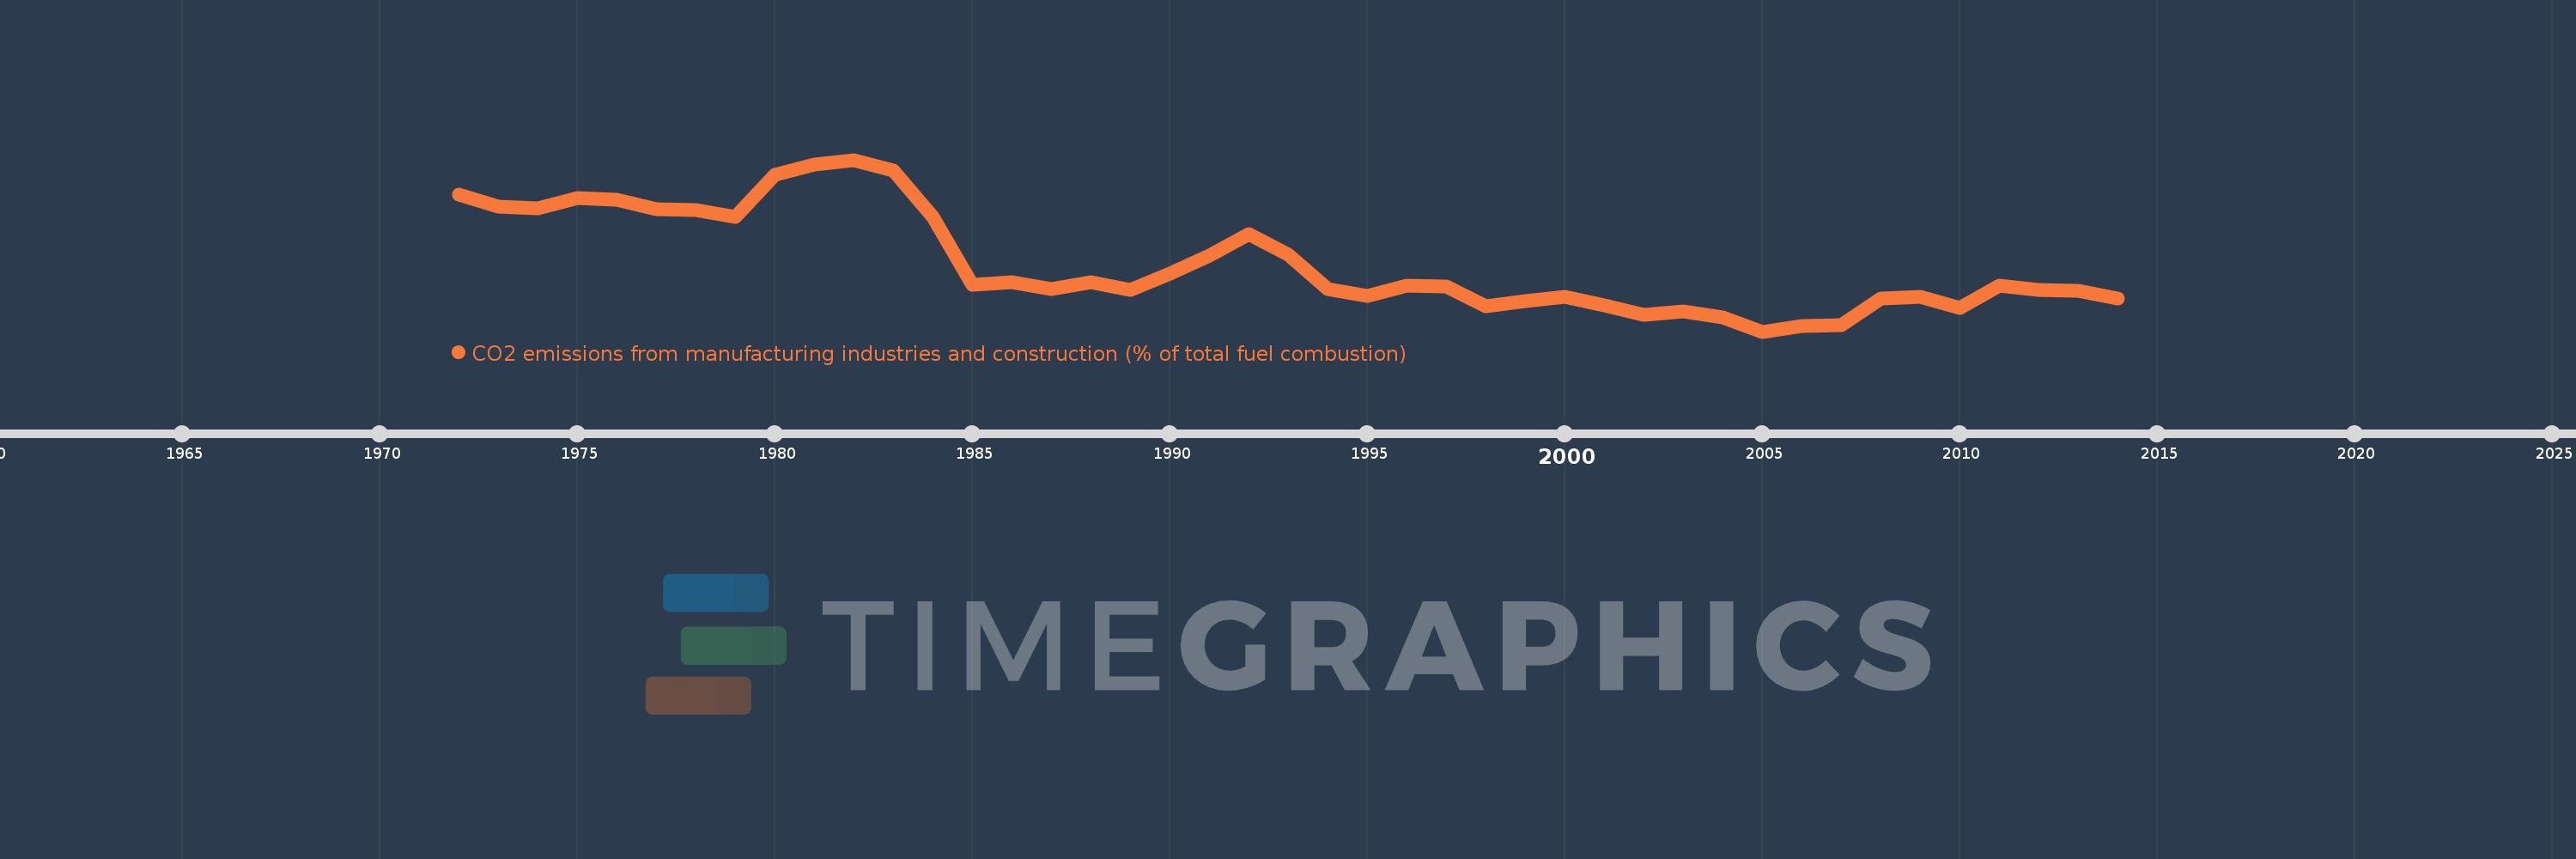
CO2 emissions from manufacturing industries and construction (% of total fuel combustion)
2014,2013,2012,2011,2010,2009,2008,2007,2006,2005,2004,2003,2002,2001,2000,1999,1998,1997,1996,1995,1994,1993,1992,1991,1990,1989,1988,1987,1986,1985,1984,1983,1982,1981,1980,1979,1978,1977,1976,1975,1974,1973,1972
Cette statistique dans les autres pays:
AlbaniaAlgeriaAngolaArab WorldArgentinaArmeniaAustraliaAustriaAzerbaijanBahrainBangladeshBelarusBelgiumBeninBoliviaBosnia and HerzegovinaBotswanaBrazilBrunei DarussalamBulgariaCambodiaCameroonCanadaCaribbean small statesCentral Europe and the BalticsChileChinaColombiaCongo, Dem. Rep.Congo, Rep.Costa RicaCote d'IvoireCroatiaCubaCuracaoCyprusCzech RepublicDenmarkDominican RepublicEarly-demographic dividendEast Asia & PacificEast Asia & Pacific (excluding high income)East Asia & Pacific (IDA & IBRD countries)EcuadorEgypt, Arab Rep.El SalvadorEritreaEstoniaEthiopiaEuro areaEurope & Central AsiaEurope & Central Asia (excluding high income)Europe & Central Asia (IDA & IBRD countries)European UnionFinlandFragile and conflict affected situationsFranceGabonGeorgiaGermanyGhanaGibraltarGreeceGuatemalaHaitiHeavily indebted poor countries (HIPC)High incomeHondurasHong Kong SAR, ChinaHungaryIBRD onlyIcelandIDA & IBRD totalIDA blendIDA onlyIDA totalIndiaIndonesiaIran, Islamic Rep.IraqIrelandIsraelItalyJamaicaJapanJordanKazakhstanKenyaKorea, Dem. People’s Rep.Korea, Rep.KosovoKuwaitKyrgyz RepublicLate-demographic dividendLatin America & Caribbean Latin America & Caribbean (excluding high income)Latin America & the Caribbean (IDA & IBRD countries)LatviaLeast developed countries: UN classificationLebanonLibyaLithuaniaLow & middle incomeLow incomeLower middle incomeLuxembourgMacedonia, FYRMalaysiaMaltaMauritiusMexicoMiddle East & North AfricaMiddle East & North Africa (excluding high income)Middle East & North Africa (IDA & IBRD countries)Middle incomeMoldovaMongoliaMontenegroMoroccoMozambiqueMyanmarNamibiaNepalNetherlandsNew ZealandNicaraguaNigerNigeriaNorth AmericaNorwayOECD membersOmanOther small statesPakistanPanamaParaguayPeruPhilippinesPolandPortugalPost-demographic dividendPre-demographic dividendQatarRomaniaRussian FederationSaudi ArabiaSenegalSerbiaSingaporeSlovak RepublicSloveniaSmall statesSouth AfricaSouth AsiaSouth Asia (IDA & IBRD)South SudanSpainSri LankaSub-Saharan Africa Sub-Saharan Africa (excluding high income)Sub-Saharan Africa (IDA & IBRD countries)SudanSwedenSwitzerlandSyrian Arab RepublicTajikistanTanzaniaThailandTogoTrinidad and TobagoTunisiaTurkeyTurkmenistanUkraineUnited Arab EmiratesUnited KingdomUnited StatesUpper middle incomeUruguayUzbekistanVenezuela, RBVietnamWorldYemen, Rep.ZambiaZimbabwe La ligne de temps
Cette échelle de temps montre un graphique de 1972 année à 2014 année Middle East & North Africa. Les données jusqu'à 1971 année ne sont pas présentés. Quantité d'observations actuelles selon dates: 43.
Source (désignation):
Les indicateurs du développement mondiale
Source (organisation):
IEA Statistics © OECD/IEA 2014 (http://www.iea.org/stats/index.asp), subject to https://www.iea.org/t&c/termsandconditions/
Catégories:
Environment
Dernière mise à jour
23 avr. 2017
Les indicateurs de changement de valeurs selon les années
Maximum:
26.601
1 janv. 1982
Pour la date d''observation
Valeur
Changement absolu
Le changement par rapport à la valeur précédente
1 janv. 1972
24.619
+24.619
0.0%
1 janv. 1973
23.891
-0.727
-2.95%
1 janv. 1974
23.792
-0.099
-0.42%
1 janv. 1975
24.389
+0.597
2.51%
1 janv. 1976
24.29
-0.099
-0.4%
1 janv. 1977
23.742
-0.548
-2.26%
1 janv. 1978
23.729
-0.013
-0.05%
1 janv. 1979
23.327
-0.402
-1.69%
1 janv. 1980
25.739
+2.411
10.34%
1 janv. 1981
26.344
+0.605
2.35%
1 janv. 1982
26.601
+0.257
0.98%
1 janv. 1983
25.972
-0.629
-2.36%
1 janv. 1984
23.32
-2.652
-10.21%
1 janv. 1985
19.383
-3.936
-16.88%
1 janv. 1986
19.523
+0.14
0.72%
1 janv. 1987
19.144
-0.379
-1.94%
1 janv. 1988
19.535
+0.391
2.04%
1 janv. 1989
19.082
-0.453
-2.32%
1 janv. 1990
20.048
+0.966
5.06%
1 janv. 1991
21.101
+1.053
5.25%
1 janv. 1992
22.34
+1.239
5.87%
1 janv. 1993
21.123
-1.217
-5.45%
1 janv. 1994
19.145
-1.978
-9.37%
1 janv. 1995
18.744
-0.401
-2.1%
1 janv. 1996
19.333
+0.589
3.14%
1 janv. 1997
19.291
-0.042
-0.22%
1 janv. 1998
18.152
-1.139
-5.9%
1 janv. 1999
18.465
+0.313
1.72%
1 janv. 2000
18.698
+0.233
1.26%
1 janv. 2001
18.223
-0.475
-2.54%
1 janv. 2002
17.686
-0.537
-2.95%
1 janv. 2003
17.88
+0.193
1.09%
1 janv. 2004
17.506
-0.374
-2.09%
1 janv. 2005
16.7
-0.806
-4.6%
1 janv. 2006
17.005
+0.305
1.83%
1 janv. 2007
17.061
+0.055
0.32%
1 janv. 2008
18.585
+1.525
8.94%
1 janv. 2009
18.697
+0.111
0.6%
1 janv. 2010
18.083
-0.614
-3.28%
1 janv. 2011
19.336
+1.253
6.93%
1 janv. 2012
19.124
-0.212
-1.09%
1 janv. 2013
19.072
-0.052
-0.27%
1 janv. 2014
18.616
-0.456
-2.39%
Classement des pays selon les statistiques actuelles par années


Commentaires: