30
/fr/
AIzaSyAYiBZKx7MnpbEhh9jyipgxe19OcubqV5w
April 1, 2024
81506
Belgium
BEL
true
2
1
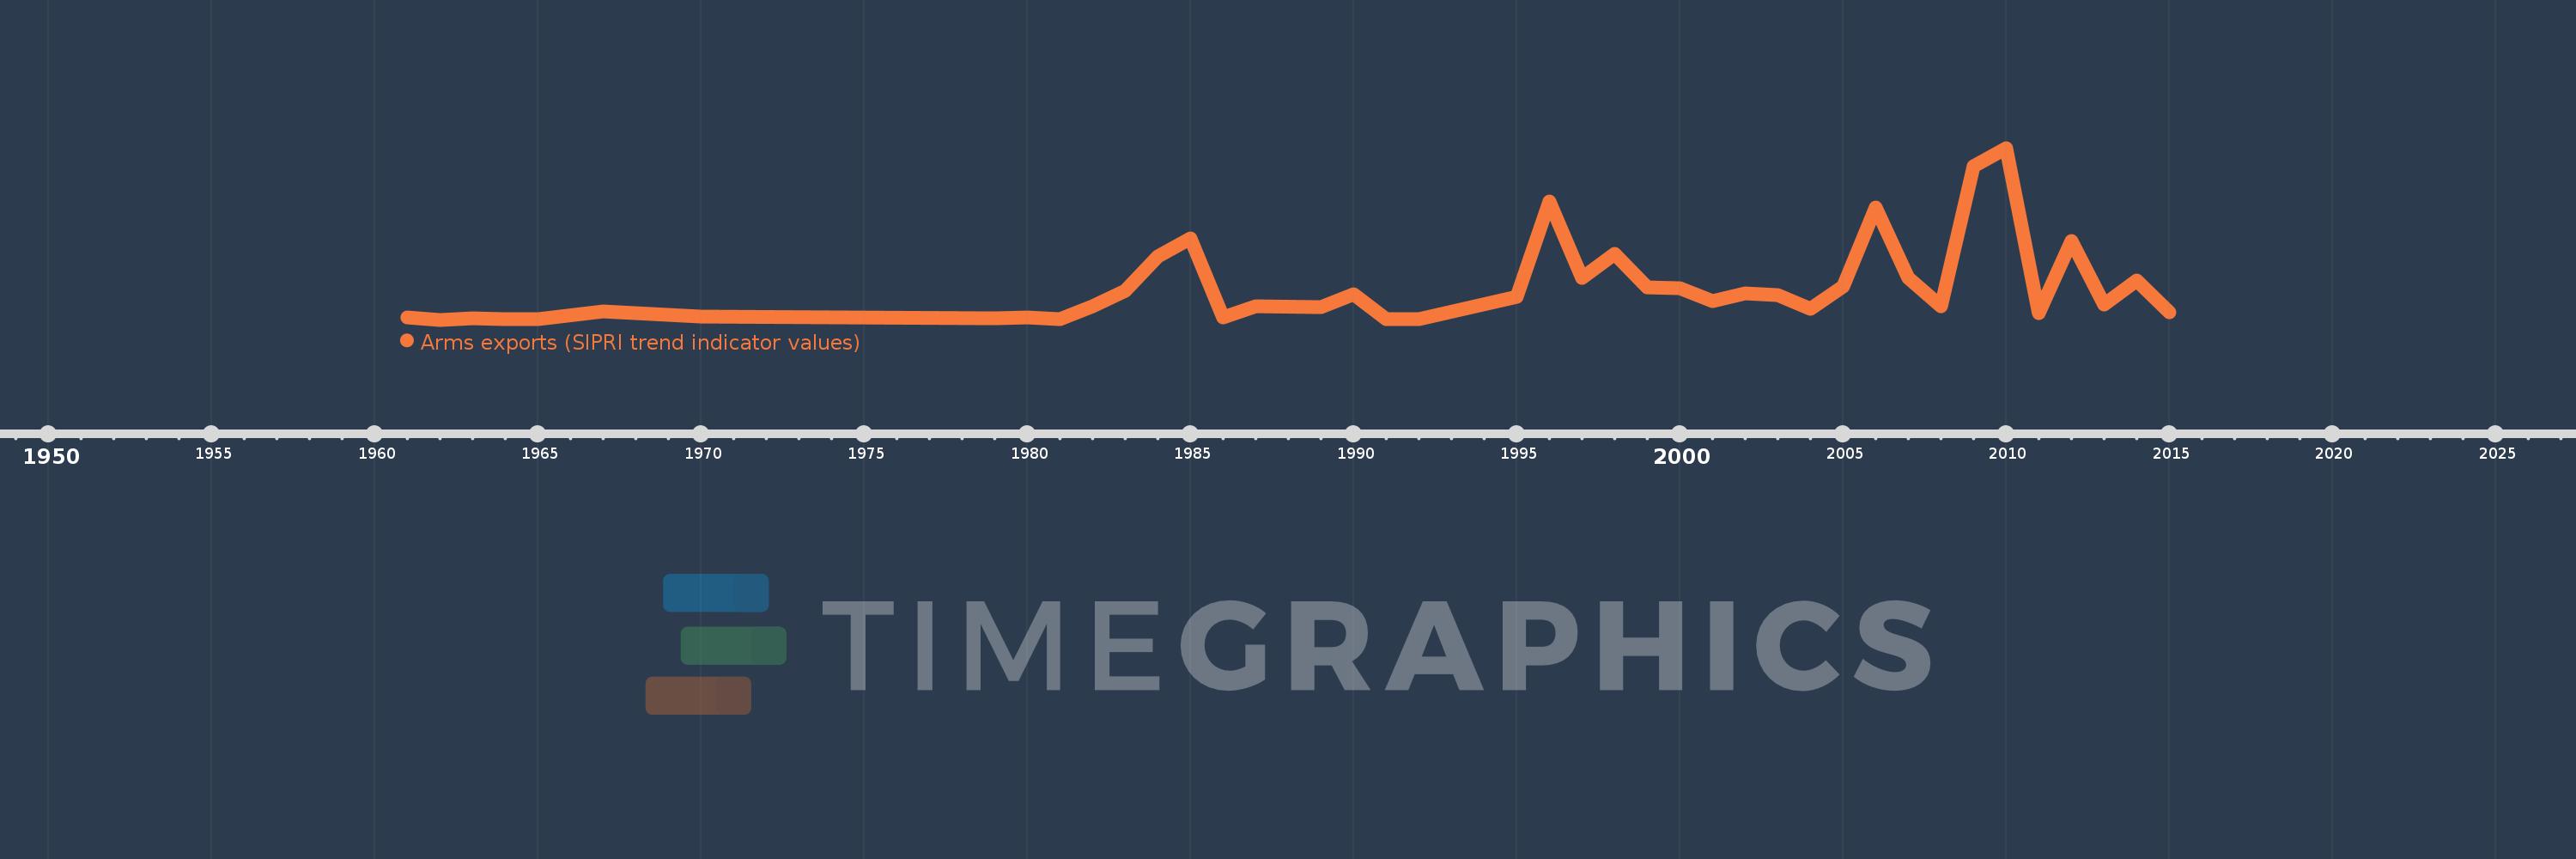
Arms exports (SIPRI trend indicator values)
2015,2014,2013,2012,2011,2010,2009,2008,2007,2006,2005,2004,2003,2002,2001,2000,1999,1998,1997,1996,1995,1992,1991,1990,1989,1987,1986,1985,1984,1983,1982,1981,1980,1979,1970,1967,1965,1964,1963,1962,1961
