30
/fr/
AIzaSyAYiBZKx7MnpbEhh9jyipgxe19OcubqV5w
April 1, 2024
179767
Libya
LBY
true
2
1
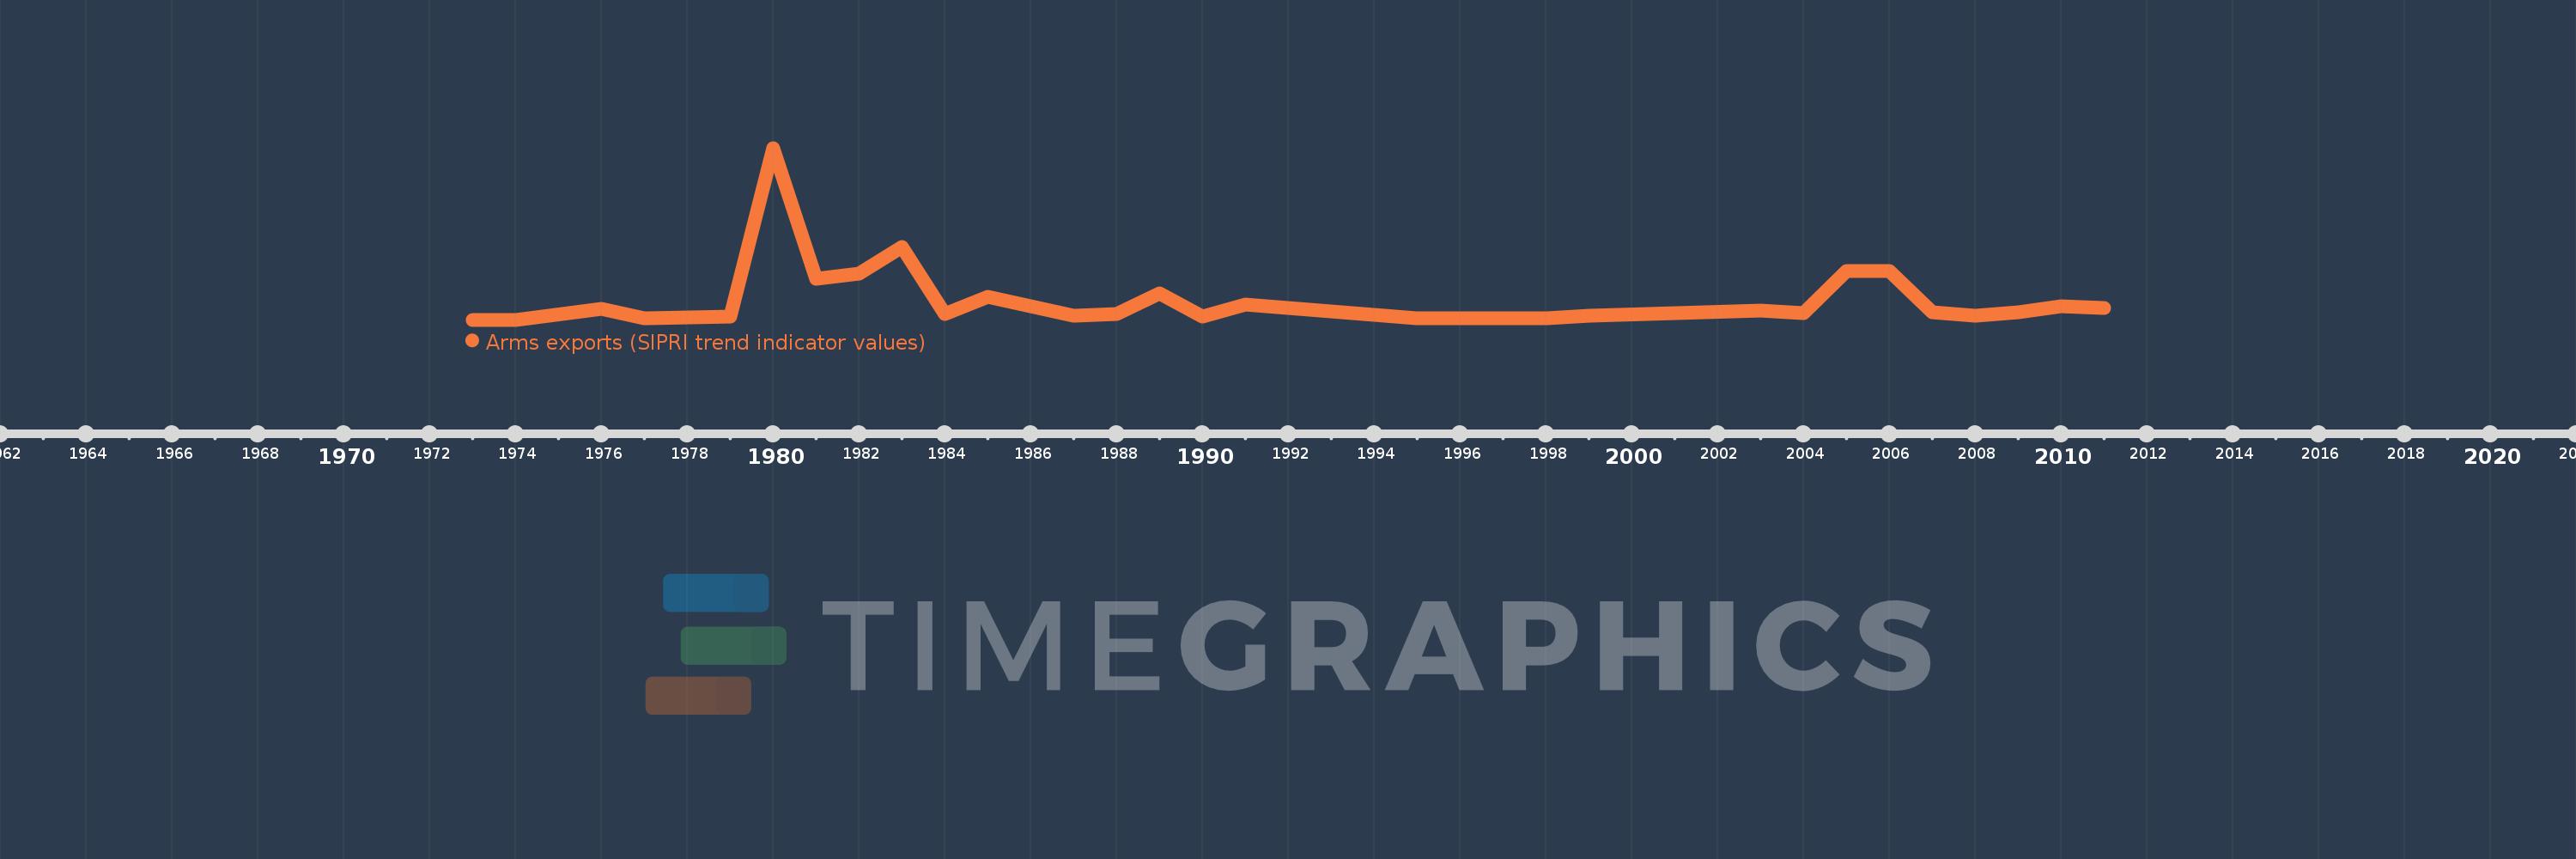
Arms exports (SIPRI trend indicator values)
2011,2010,2009,2008,2007,2006,2005,2004,2003,1999,1998,1995,1991,1990,1989,1988,1987,1986,1985,1984,1983,1982,1981,1980,1979,1977,1976,1974,1973
