29
/fr/
fr
AIzaSyAYiBZKx7MnpbEhh9jyipgxe19OcubqV5w
April 1, 2024
31323
Europe & Central Asia (excluding high income)
ECA
false
2
1
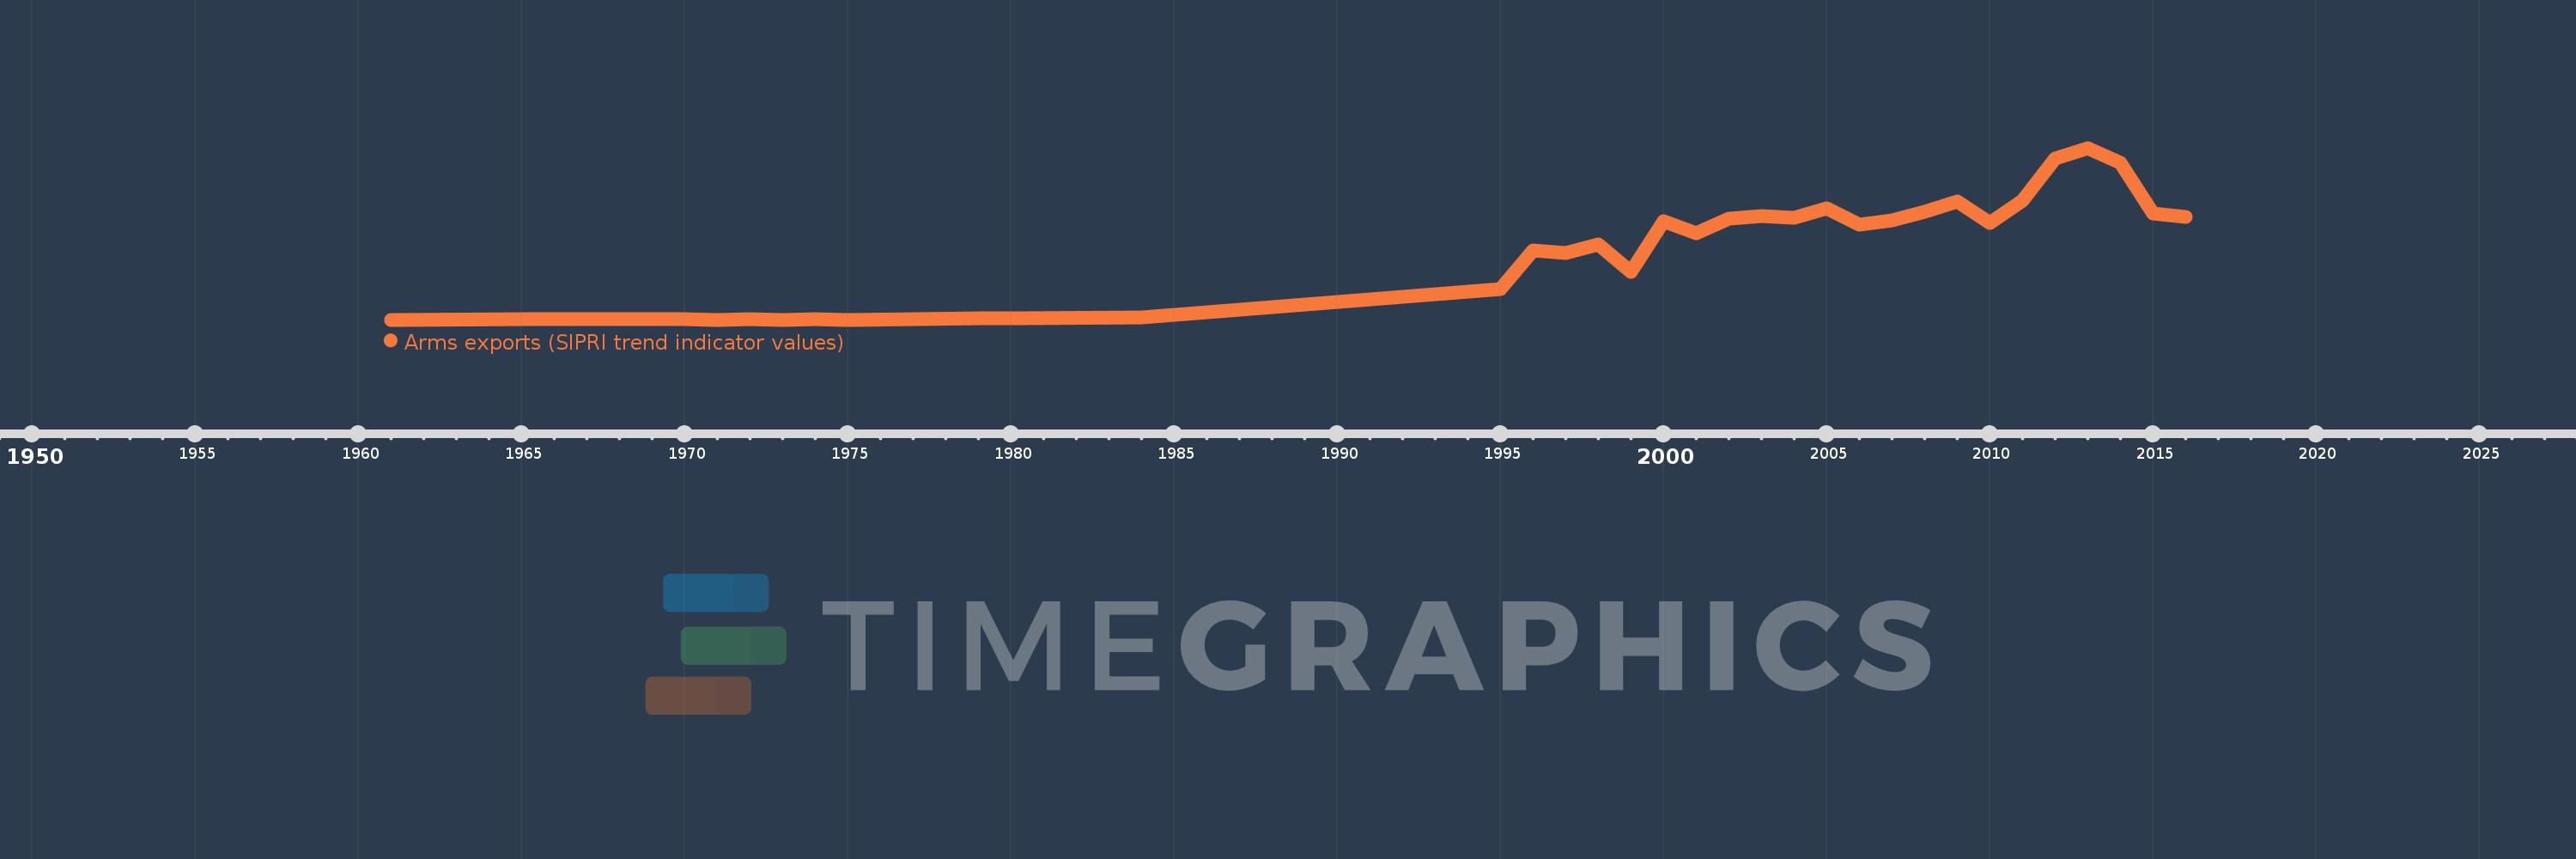
Arms exports (SIPRI trend indicator values)
2016,2015,2014,2013,2012,2011,2010,2009,2008,2007,2006,2005,2004,2003,2002,2001,2000,1999,1998,1997,1996,1995,1984,1980,1979,1975,1974,1973,1972,1971,1970,1966,1965,1961
Cette statistique dans les autres pays:
La ligne de temps
Cette échelle de temps montre un graphique de 1961 année à 2016 année Europe & Central Asia (excluding high income). Les données jusqu'à 1960 année ne sont pas présentés. Quantité d'observations actuelles selon dates: 34.
Source (désignation):
Les indicateurs du développement mondiale
Source (organisation):
Stockholm International Peace Research Institute (SIPRI), Arms Transfers Programme (http://portal.sipri.org/publications/pages/transfer/splash).
Catégories:
Public Sector, Trade
Dernière mise à jour
23 avr. 2017
Les indicateurs de changement de valeurs selon les années
Minimum:
1000.0 milles
1 janv. 1975
Maximum:
10.278 mds
1 janv. 2013
Pour la date d''observation
Valeur
Changement absolu
Le changement par rapport à la valeur précédente
1 janv. 1961
6.0 mln.
+6.0 mln.
0.0%
1 janv. 1965
18.0 mln.
+12.0 mln.
200.0%
1 janv. 1966
31.0 mln.
+13.0 mln.
72.22%
1 janv. 1970
21.0 mln.
-10.0 mln.
-32.26%
1 janv. 1971
3.0 mln.
-18.0 mln.
-85.71%
1 janv. 1972
27.0 mln.
+24.0 mln.
800.0%
1 janv. 1973
9.0 mln.
-18.0 mln.
-66.67%
1 janv. 1974
30.0 mln.
+21.0 mln.
233.33%
1 janv. 1975
1000.0 milles
-29.0 mln.
-96.67%
1 janv. 1979
80.0 mln.
+79.0 mln.
7.9 milles%
1 janv. 1980
77.0 mln.
-3.0 mln.
-3.75%
1 janv. 1984
152.0 mln.
+75.0 mln.
97.4%
1 janv. 1995
1.834 mds
+1.682 mds
1.11 milles%
1 janv. 1996
4.146 mds
+2.312 mds
126.06%
1 janv. 1997
3.972 mds
-174.0 mln.
-4.2%
1 janv. 1998
4.488 mds
+516.0 mln.
12.99%
1 janv. 1999
2.861 mds
-1.627 mds
-36.25%
1 janv. 2000
5.902 mds
+3.041 mds
106.29%
1 janv. 2001
5.184 mds
-718.0 mln.
-12.17%
1 janv. 2002
6.056 mds
+872.0 mln.
16.82%
1 janv. 2003
6.183 mds
+127.0 mln.
2.1%
1 janv. 2004
6.113 mds
-70.0 mln.
-1.13%
1 janv. 2005
6.661 mds
+548.0 mln.
8.96%
1 janv. 2006
5.689 mds
-972.0 mln.
-14.59%
1 janv. 2007
5.938 mds
+249.0 mln.
4.38%
1 janv. 2008
6.448 mds
+510.0 mln.
8.59%
1 janv. 2009
7.056 mds
+608.0 mln.
9.43%
1 janv. 2010
5.799 mds
-1.257 mds
-17.81%
1 janv. 2011
7.136 mds
+1.337 mds
23.06%
1 janv. 2012
9.671 mds
+2.535 mds
35.52%
1 janv. 2013
10.278 mds
+607.0 mln.
6.28%
1 janv. 2014
9.381 mds
-897.0 mln.
-8.73%
1 janv. 2015
6.332 mds
-3.049 mds
-32.5%
1 janv. 2016
6.164 mds
-168.0 mln.
-2.65%
Classement des pays selon les statistiques actuelles par années


Commentaires: