29
/fr/
fr
AIzaSyAYiBZKx7MnpbEhh9jyipgxe19OcubqV5w
April 1, 2024
75899
Bahamas, The
BHS
true
2
1
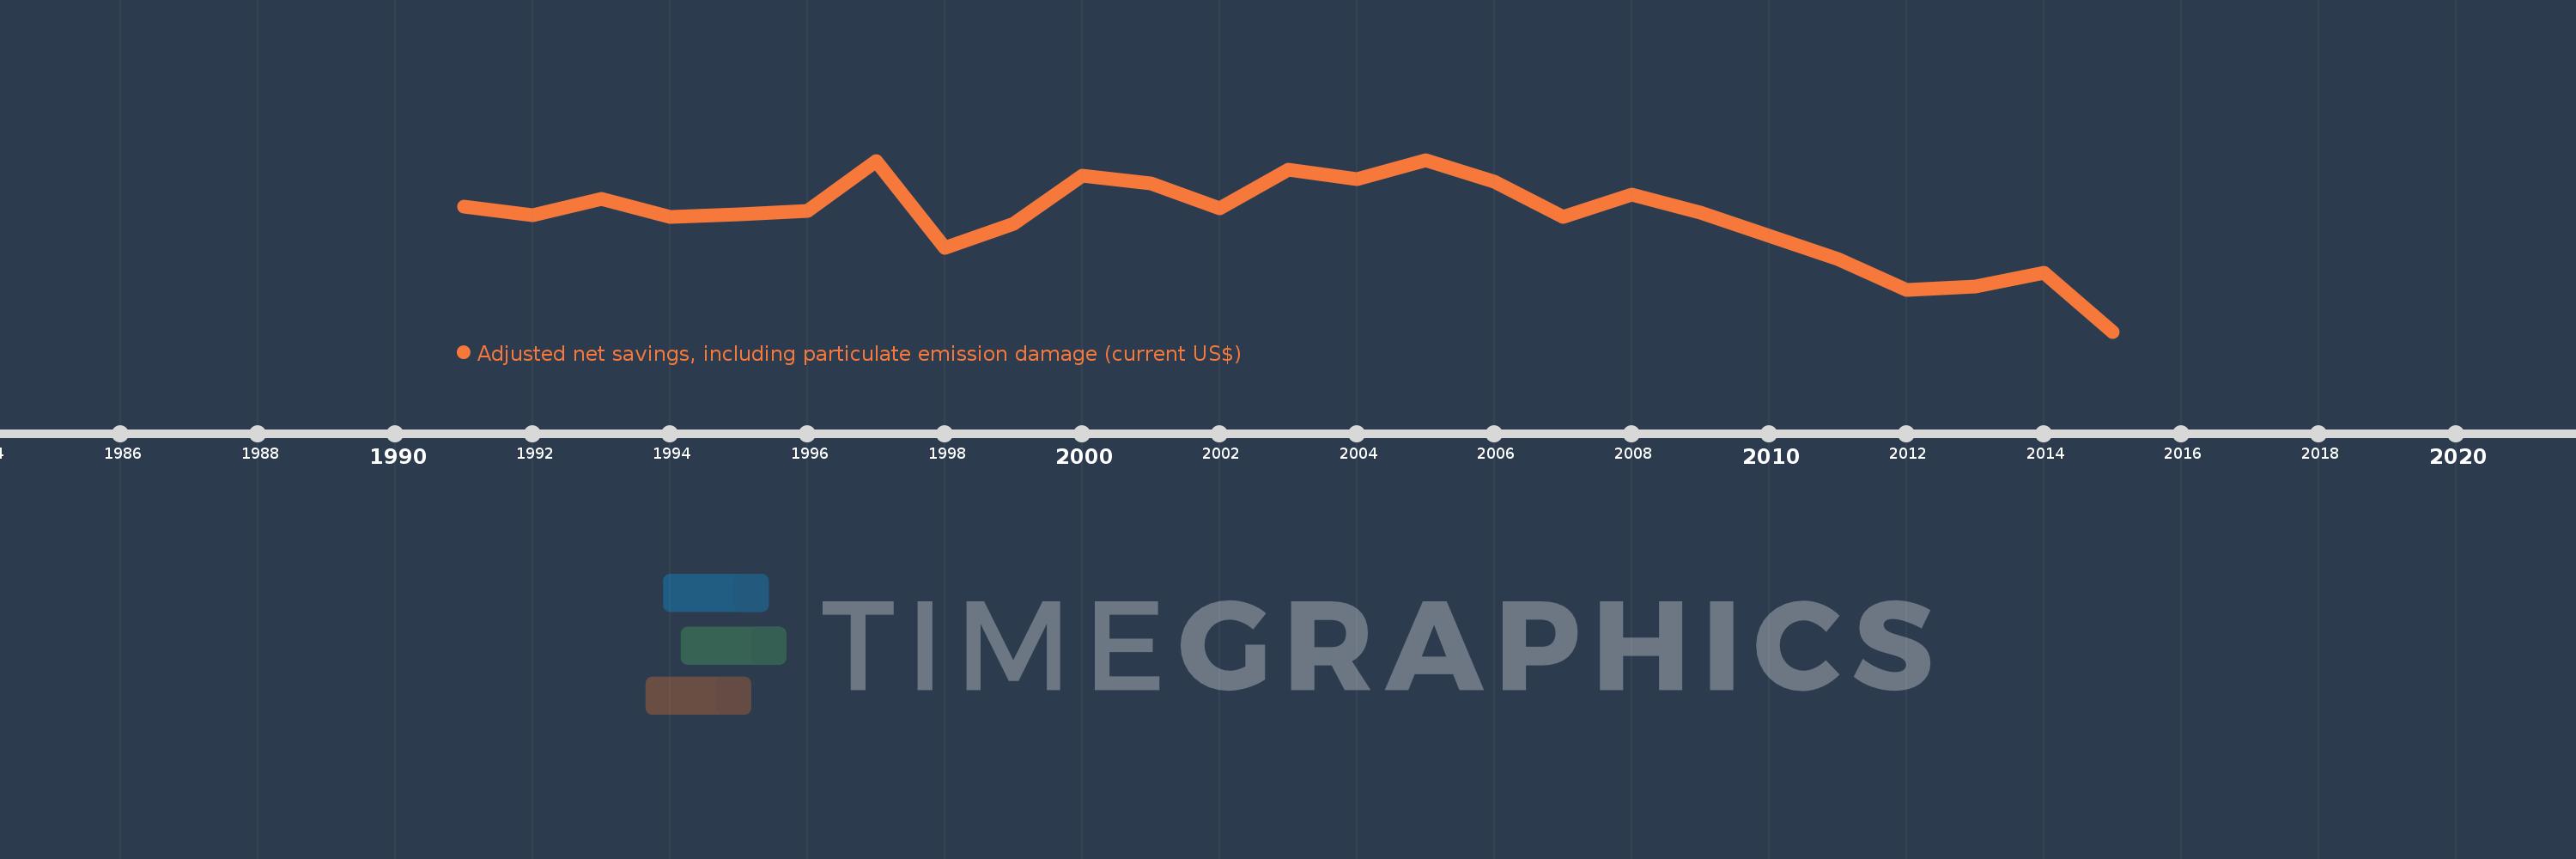
Adjusted net savings, including particulate emission damage (current US$)
2015,2014,2013,2012,2011,2010,2009,2008,2007,2006,2005,2004,2003,2002,2001,2000,1999,1998,1997,1996,1995,1994,1993,1992,1991
Cette statistique dans les autres pays:
AfghanistanAlbaniaAlgeriaAngolaArgentinaArmeniaAustraliaAustriaAzerbaijanBahamas, TheBahrainBangladeshBarbadosBelarusBelgiumBelizeBeninBhutanBoliviaBotswanaBrazilBrunei DarussalamBulgariaBurkina FasoBurundiCabo VerdeCambodiaCameroonCanadaCentral African RepublicChadChileChinaColombiaComorosCongo, Dem. Rep.Congo, Rep.Costa RicaCote d'IvoireCroatiaCyprusCzech RepublicDenmarkDominican RepublicEcuadorEgypt, Arab Rep.El SalvadorEquatorial GuineaEritreaEstoniaEthiopiaFijiFinlandFranceGabonGambia, TheGeorgiaGermanyGhanaGreeceGuatemalaGuineaGuinea-BissauGuyanaHaitiHondurasHungaryIcelandIndiaIndonesiaIran, Islamic Rep.IraqIrelandIsraelItalyJamaicaJapanJordanKazakhstanKenyaKorea, Rep.KuwaitKyrgyz RepublicLao PDRLatviaLebanonLesothoLiberiaLibyaLithuaniaLuxembourgMacedonia, FYRMadagascarMalawiMalaysiaMaldivesMaliMauritaniaMauritiusMexicoMoldovaMongoliaMoroccoMozambiqueNamibiaNepalNetherlandsNew ZealandNicaraguaNigerNigeriaNorwayOmanPakistanPanamaPapua New GuineaParaguayPeruPhilippinesPolandPortugalQatarRomaniaRussian FederationRwandaSaudi ArabiaSenegalSierra LeoneSingaporeSlovak RepublicSloveniaSolomon IslandsSouth AfricaSpainSri LankaSudanSurinameSwazilandSwedenSwitzerlandSyrian Arab RepublicTajikistanTanzaniaThailandTogoTrinidad and TobagoTunisiaTurkeyUgandaUkraineUnited KingdomUnited StatesUruguayVenezuela, RBVietnamYemen, Rep.ZambiaZimbabwe La ligne de temps
Cette échelle de temps montre un graphique de 1991 année à 2015 année Bahamas, The. Les données jusqu'à 1990 année ne sont pas présentés. Quantité d'observations actuelles selon dates: 25.
Source (désignation):
Les indicateurs du développement mondiale
Source (organisation):
World Bank staff estimates based on sources and methods in World Bank's "The Changing Wealth of Nations: Measuring Sustainable Development in the New Millennium" (2011).
Catégories:
Economy & Growth, Environment
Dernière mise à jour
23 avr. 2017
Les indicateurs de changement de valeurs selon les années
Minimum:
183.651 mln.
1 janv. 2015
Maximum:
1.57 mds
1 janv. 2005
Pour la date d''observation
Valeur
Changement absolu
Le changement par rapport à la valeur précédente
1 janv. 1991
1.189 mds
+1.189 mds
0.0%
1 janv. 1992
1.12 mds
-69.186 mln.
-5.82%
1 janv. 1993
1.258 mds
+137.945 mln.
12.32%
1 janv. 1994
1.107 mds
-150.978 mln.
-12.0%
1 janv. 1995
1.128 mds
+21.745 mln.
1.96%
1 janv. 1996
1.155 mds
+26.894 mln.
2.38%
1 janv. 1997
1.559 mds
+403.689 mln.
34.94%
1 janv. 1998
858.411 mln.
-700.592 mln.
-44.94%
1 janv. 1999
1.055 mds
+196.874 mln.
22.93%
1 janv. 2000
1.441 mds
+385.369 mln.
36.52%
1 janv. 2001
1.376 mds
-64.684 mln.
-4.49%
1 janv. 2002
1.176 mds
-200.034 mln.
-14.54%
1 janv. 2003
1.487 mds
+311.043 mln.
26.45%
1 janv. 2004
1.411 mds
-76.226 mln.
-5.13%
1 janv. 2005
1.57 mds
+158.843 mln.
11.26%
1 janv. 2006
1.392 mds
-177.809 mln.
-11.33%
1 janv. 2007
1.109 mds
-283.21 mln.
-20.35%
1 janv. 2008
1.289 mds
+180.404 mln.
16.27%
1 janv. 2009
1.14 mds
-148.935 mln.
-11.55%
1 janv. 2010
954.351 mln.
-185.695 mln.
-16.29%
1 janv. 2011
772.475 mln.
-181.876 mln.
-19.06%
1 janv. 2012
518.636 mln.
-253.839 mln.
-32.86%
1 janv. 2013
548.083 mln.
+29.447 mln.
5.68%
1 janv. 2014
661.026 mln.
+112.943 mln.
20.61%
1 janv. 2015
183.651 mln.
-477.375 mln.
-72.22%
Classement des pays selon les statistiques actuelles par années


Commentaires: