29
/fr/
fr
AIzaSyAYiBZKx7MnpbEhh9jyipgxe19OcubqV5w
April 1, 2024
147591
Guyana
GUY
true
2
1
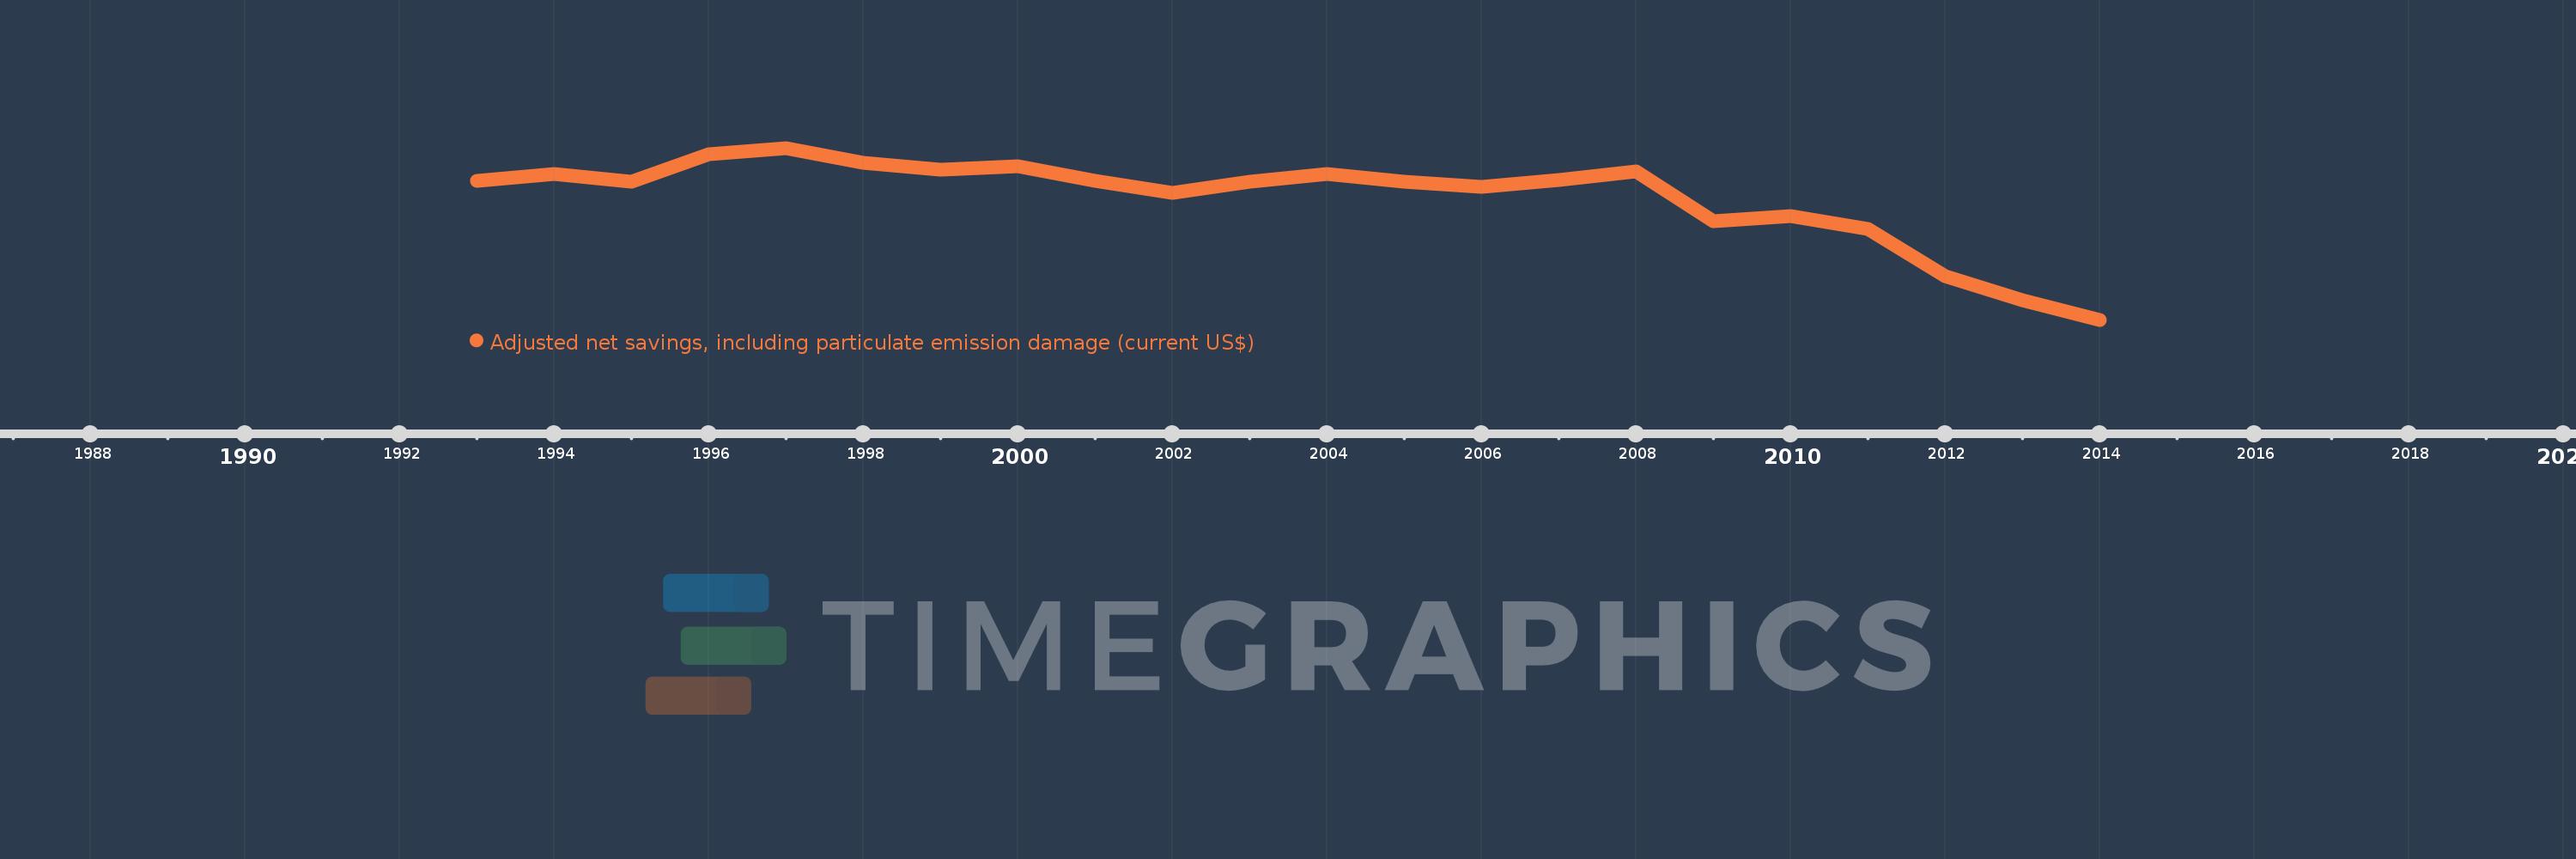
Adjusted net savings, including particulate emission damage (current US$)
2014,2013,2012,2011,2010,2009,2008,2007,2006,2005,2004,2003,2002,2001,2000,1999,1998,1997,1996,1995,1994,1993
Cette statistique dans les autres pays:
AfghanistanAlbaniaAlgeriaAngolaArgentinaArmeniaAustraliaAustriaAzerbaijanBahamas, TheBahrainBangladeshBarbadosBelarusBelgiumBelizeBeninBhutanBoliviaBotswanaBrazilBrunei DarussalamBulgariaBurkina FasoBurundiCabo VerdeCambodiaCameroonCanadaCentral African RepublicChadChileChinaColombiaComorosCongo, Dem. Rep.Congo, Rep.Costa RicaCote d'IvoireCroatiaCyprusCzech RepublicDenmarkDominican RepublicEcuadorEgypt, Arab Rep.El SalvadorEquatorial GuineaEritreaEstoniaEthiopiaFijiFinlandFranceGabonGambia, TheGeorgiaGermanyGhanaGreeceGuatemalaGuineaGuinea-BissauGuyanaHaitiHondurasHungaryIcelandIndiaIndonesiaIran, Islamic Rep.IraqIrelandIsraelItalyJamaicaJapanJordanKazakhstanKenyaKorea, Rep.KuwaitKyrgyz RepublicLao PDRLatviaLebanonLesothoLiberiaLibyaLithuaniaLuxembourgMacedonia, FYRMadagascarMalawiMalaysiaMaldivesMaliMauritaniaMauritiusMexicoMoldovaMongoliaMoroccoMozambiqueNamibiaNepalNetherlandsNew ZealandNicaraguaNigerNigeriaNorwayOmanPakistanPanamaPapua New GuineaParaguayPeruPhilippinesPolandPortugalQatarRomaniaRussian FederationRwandaSaudi ArabiaSenegalSierra LeoneSingaporeSlovak RepublicSloveniaSolomon IslandsSouth AfricaSpainSri LankaSudanSurinameSwazilandSwedenSwitzerlandSyrian Arab RepublicTajikistanTanzaniaThailandTogoTrinidad and TobagoTunisiaTurkeyUgandaUkraineUnited KingdomUnited StatesUruguayVenezuela, RBVietnamYemen, Rep.ZambiaZimbabwe La ligne de temps
Cette échelle de temps montre un graphique de 1993 année à 2014 année Guyana. Les données jusqu'à 1992 année ne sont pas présentés. Quantité d'observations actuelles selon dates: 22.
Source (désignation):
Les indicateurs du développement mondiale
Source (organisation):
World Bank staff estimates based on sources and methods in World Bank's "The Changing Wealth of Nations: Measuring Sustainable Development in the New Millennium" (2011).
Catégories:
Economy & Growth, Environment
Dernière mise à jour
23 avr. 2017
Les indicateurs de changement de valeurs selon les années
Minimum:
-313.306 mln.
1 janv. 2014
Maximum:
150.065 mln.
1 janv. 1997
Pour la date d''observation
Valeur
Changement absolu
Le changement par rapport à la valeur précédente
1 janv. 1993
61.323 mln.
+61.323 mln.
0.0%
1 janv. 1994
80.43 mln.
+19.107 mln.
31.16%
1 janv. 1995
59.72 mln.
-20.711 mln.
-25.75%
1 janv. 1996
133.875 mln.
+74.155 mln.
124.17%
1 janv. 1997
150.065 mln.
+16.19 mln.
12.09%
1 janv. 1998
110.836 mln.
-39.229 mln.
-26.14%
1 janv. 1999
90.864 mln.
-19.971 mln.
-18.02%
1 janv. 2000
100.003 mln.
+9.138 mln.
10.06%
1 janv. 2001
62.012 mln.
-37.99 mln.
-37.99%
1 janv. 2002
29.407 mln.
-32.605 mln.
-52.58%
1 janv. 2003
58.891 mln.
+29.485 mln.
100.26%
1 janv. 2004
78.84 mln.
+19.949 mln.
33.87%
1 janv. 2005
58.156 mln.
-20.685 mln.
-26.24%
1 janv. 2006
45.164 mln.
-12.992 mln.
-22.34%
1 janv. 2007
62.69 mln.
+17.527 mln.
38.81%
1 janv. 2008
87.212 mln.
+24.522 mln.
39.12%
1 janv. 2009
-47.998 mln.
-135.21 mln.
-155.04%
1 janv. 2010
-34.548 mln.
+13.45 mln.
-28.02%
1 janv. 2011
-69.264 mln.
-34.716 mln.
100.49%
1 janv. 2012
-195.435 mln.
-126.171 mln.
182.16%
1 janv. 2013
-260.568 mln.
-65.133 mln.
33.33%
1 janv. 2014
-313.306 mln.
-52.738 mln.
20.24%
Classement des pays selon les statistiques actuelles par années


Commentaires: