29
/fr/
fr
AIzaSyAYiBZKx7MnpbEhh9jyipgxe19OcubqV5w
April 1, 2024
202496
Mozambique
MOZ
true
2
1
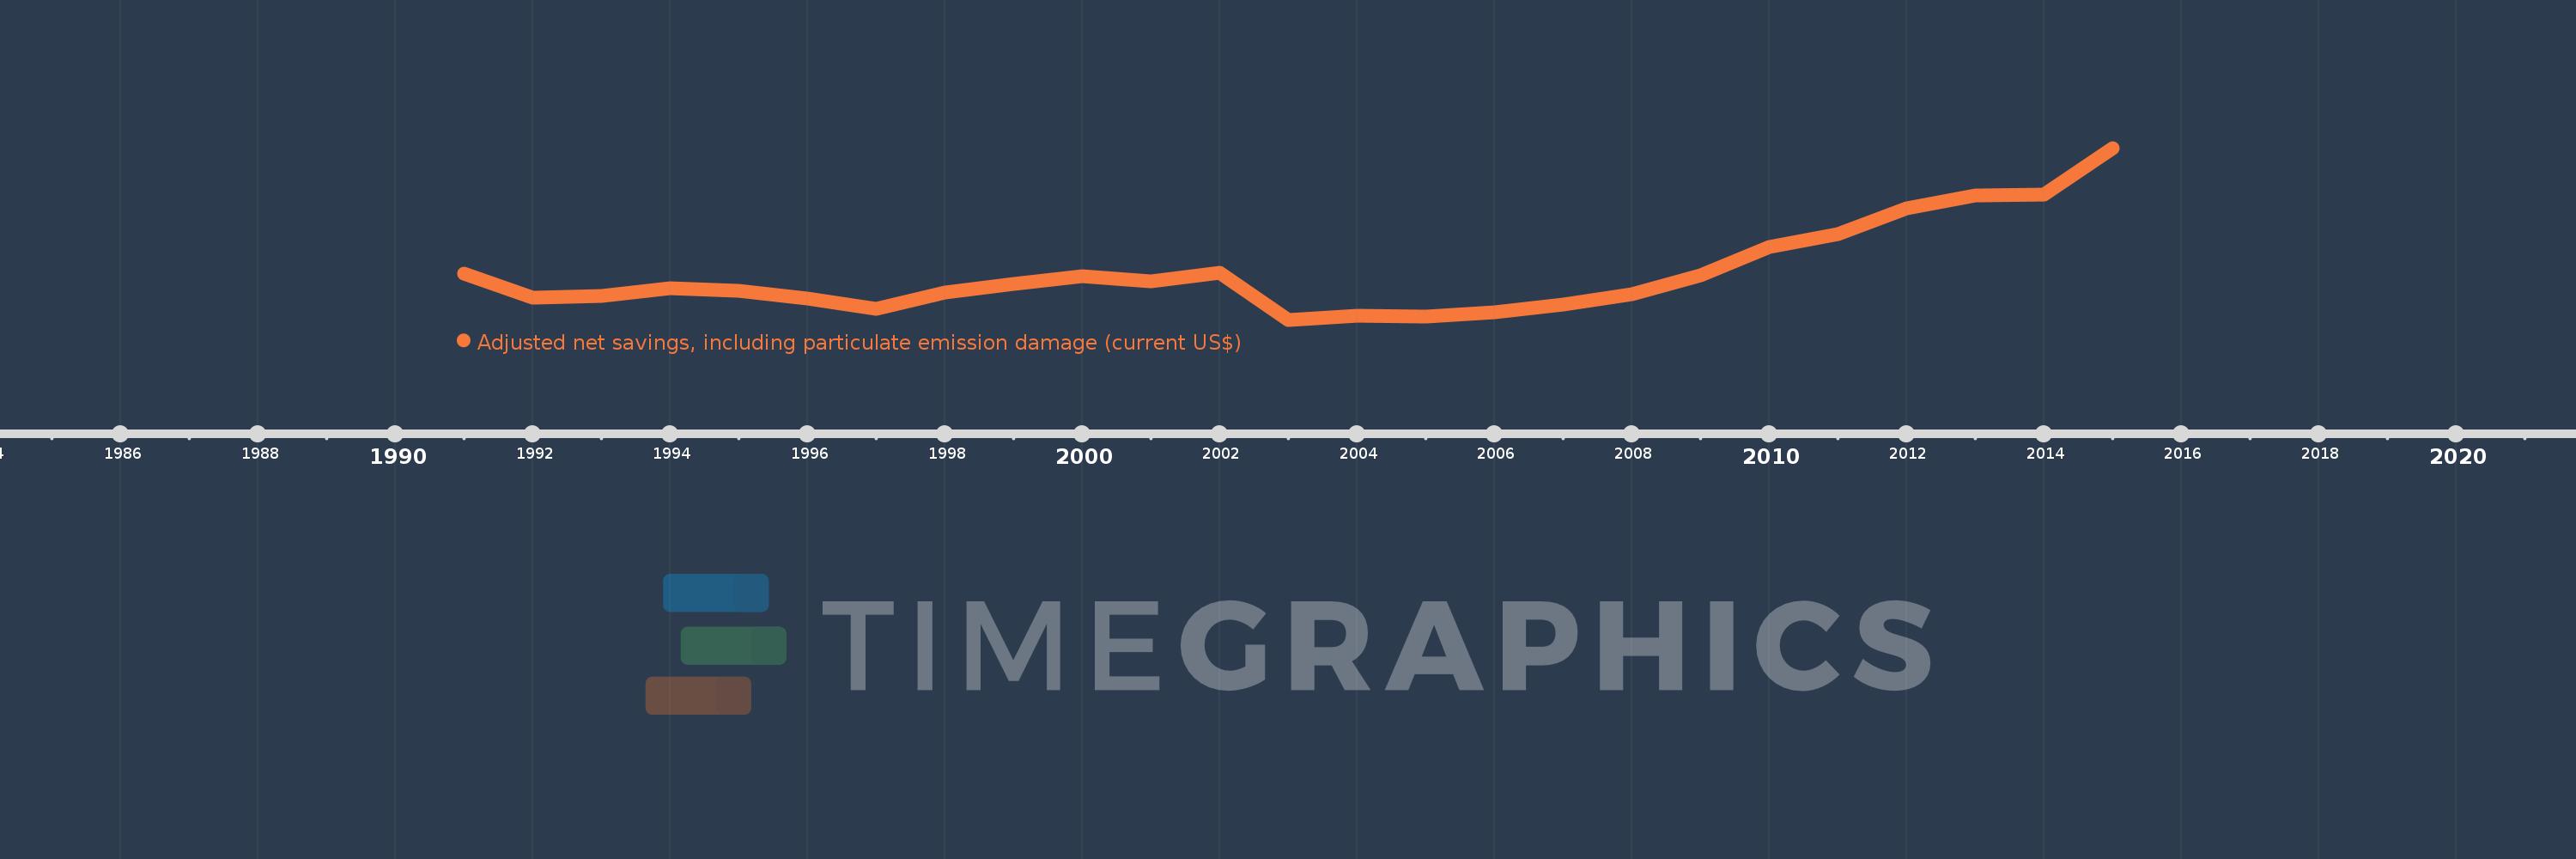
Adjusted net savings, including particulate emission damage (current US$)
2015,2014,2013,2012,2011,2010,2009,2008,2007,2006,2005,2004,2003,2002,2001,2000,1999,1998,1997,1996,1995,1994,1993,1992,1991
Cette statistique dans les autres pays:
AfghanistanAlbaniaAlgeriaAngolaArgentinaArmeniaAustraliaAustriaAzerbaijanBahamas, TheBahrainBangladeshBarbadosBelarusBelgiumBelizeBeninBhutanBoliviaBotswanaBrazilBrunei DarussalamBulgariaBurkina FasoBurundiCabo VerdeCambodiaCameroonCanadaCentral African RepublicChadChileChinaColombiaComorosCongo, Dem. Rep.Congo, Rep.Costa RicaCote d'IvoireCroatiaCyprusCzech RepublicDenmarkDominican RepublicEcuadorEgypt, Arab Rep.El SalvadorEquatorial GuineaEritreaEstoniaEthiopiaFijiFinlandFranceGabonGambia, TheGeorgiaGermanyGhanaGreeceGuatemalaGuineaGuinea-BissauGuyanaHaitiHondurasHungaryIcelandIndiaIndonesiaIran, Islamic Rep.IraqIrelandIsraelItalyJamaicaJapanJordanKazakhstanKenyaKorea, Rep.KuwaitKyrgyz RepublicLao PDRLatviaLebanonLesothoLiberiaLibyaLithuaniaLuxembourgMacedonia, FYRMadagascarMalawiMalaysiaMaldivesMaliMauritaniaMauritiusMexicoMoldovaMongoliaMoroccoMozambiqueNamibiaNepalNetherlandsNew ZealandNicaraguaNigerNigeriaNorwayOmanPakistanPanamaPapua New GuineaParaguayPeruPhilippinesPolandPortugalQatarRomaniaRussian FederationRwandaSaudi ArabiaSenegalSierra LeoneSingaporeSlovak RepublicSloveniaSolomon IslandsSouth AfricaSpainSri LankaSudanSurinameSwazilandSwedenSwitzerlandSyrian Arab RepublicTajikistanTanzaniaThailandTogoTrinidad and TobagoTunisiaTurkeyUgandaUkraineUnited KingdomUnited StatesUruguayVenezuela, RBVietnamYemen, Rep.ZambiaZimbabwe La ligne de temps
Cette échelle de temps montre un graphique de 1991 année à 2015 année Mozambique. Les données jusqu'à 1990 année ne sont pas présentés. Quantité d'observations actuelles selon dates: 25.
Source (désignation):
Les indicateurs du développement mondiale
Source (organisation):
World Bank staff estimates based on sources and methods in World Bank's "The Changing Wealth of Nations: Measuring Sustainable Development in the New Millennium" (2011).
Catégories:
Economy & Growth, Environment
Dernière mise à jour
23 avr. 2017
Les indicateurs de changement de valeurs selon les années
Minimum:
-566.428 mln.
1 janv. 2003
Maximum:
1.331 mds
1 janv. 2015
Pour la date d''observation
Valeur
Changement absolu
Le changement par rapport à la valeur précédente
1 janv. 1991
-58.388 mln.
-58.388 mln.
0.0%
1 janv. 1992
-320.04 mln.
-261.652 mln.
448.12%
1 janv. 1993
-301.462 mln.
+18.578 mln.
-5.81%
1 janv. 1994
-220.6 mln.
+80.862 mln.
-26.82%
1 janv. 1995
-248.04 mln.
-27.44 mln.
12.44%
1 janv. 1996
-328.28 mln.
-80.24 mln.
32.35%
1 janv. 1997
-446.094 mln.
-117.814 mln.
35.89%
1 janv. 1998
-268.728 mln.
+177.366 mln.
-39.76%
1 janv. 1999
-167.863 mln.
+100.865 mln.
-37.53%
1 janv. 2000
-82.875 mln.
+84.988 mln.
-50.63%
1 janv. 2001
-141.498 mln.
-58.623 mln.
70.74%
1 janv. 2002
-48.31 mln.
+93.187 mln.
-65.86%
1 janv. 2003
-566.428 mln.
-518.118 mln.
1.07 milles%
1 janv. 2004
-524.955 mln.
+41.473 mln.
-7.32%
1 janv. 2005
-532.419 mln.
-7.464 mln.
1.42%
1 janv. 2006
-480.513 mln.
+51.906 mln.
-9.75%
1 janv. 2007
-400.053 mln.
+80.461 mln.
-16.74%
1 janv. 2008
-283.998 mln.
+116.055 mln.
-29.01%
1 janv. 2009
-78.373 mln.
+205.625 mln.
-72.4%
1 janv. 2010
240.022 mln.
+318.395 mln.
-406.26%
1 janv. 2011
382.087 mln.
+142.064 mln.
59.19%
1 janv. 2012
664.807 mln.
+282.72 mln.
73.99%
1 janv. 2013
802.606 mln.
+137.799 mln.
20.73%
1 janv. 2014
813.2 mln.
+10.595 mln.
1.32%
1 janv. 2015
1.331 mds
+517.665 mln.
63.66%
Classement des pays selon les statistiques actuelles par années


Commentaires: