29
/fr/
fr
AIzaSyAYiBZKx7MnpbEhh9jyipgxe19OcubqV5w
April 1, 2024
75897
Bahamas, The
BHS
true
2
1
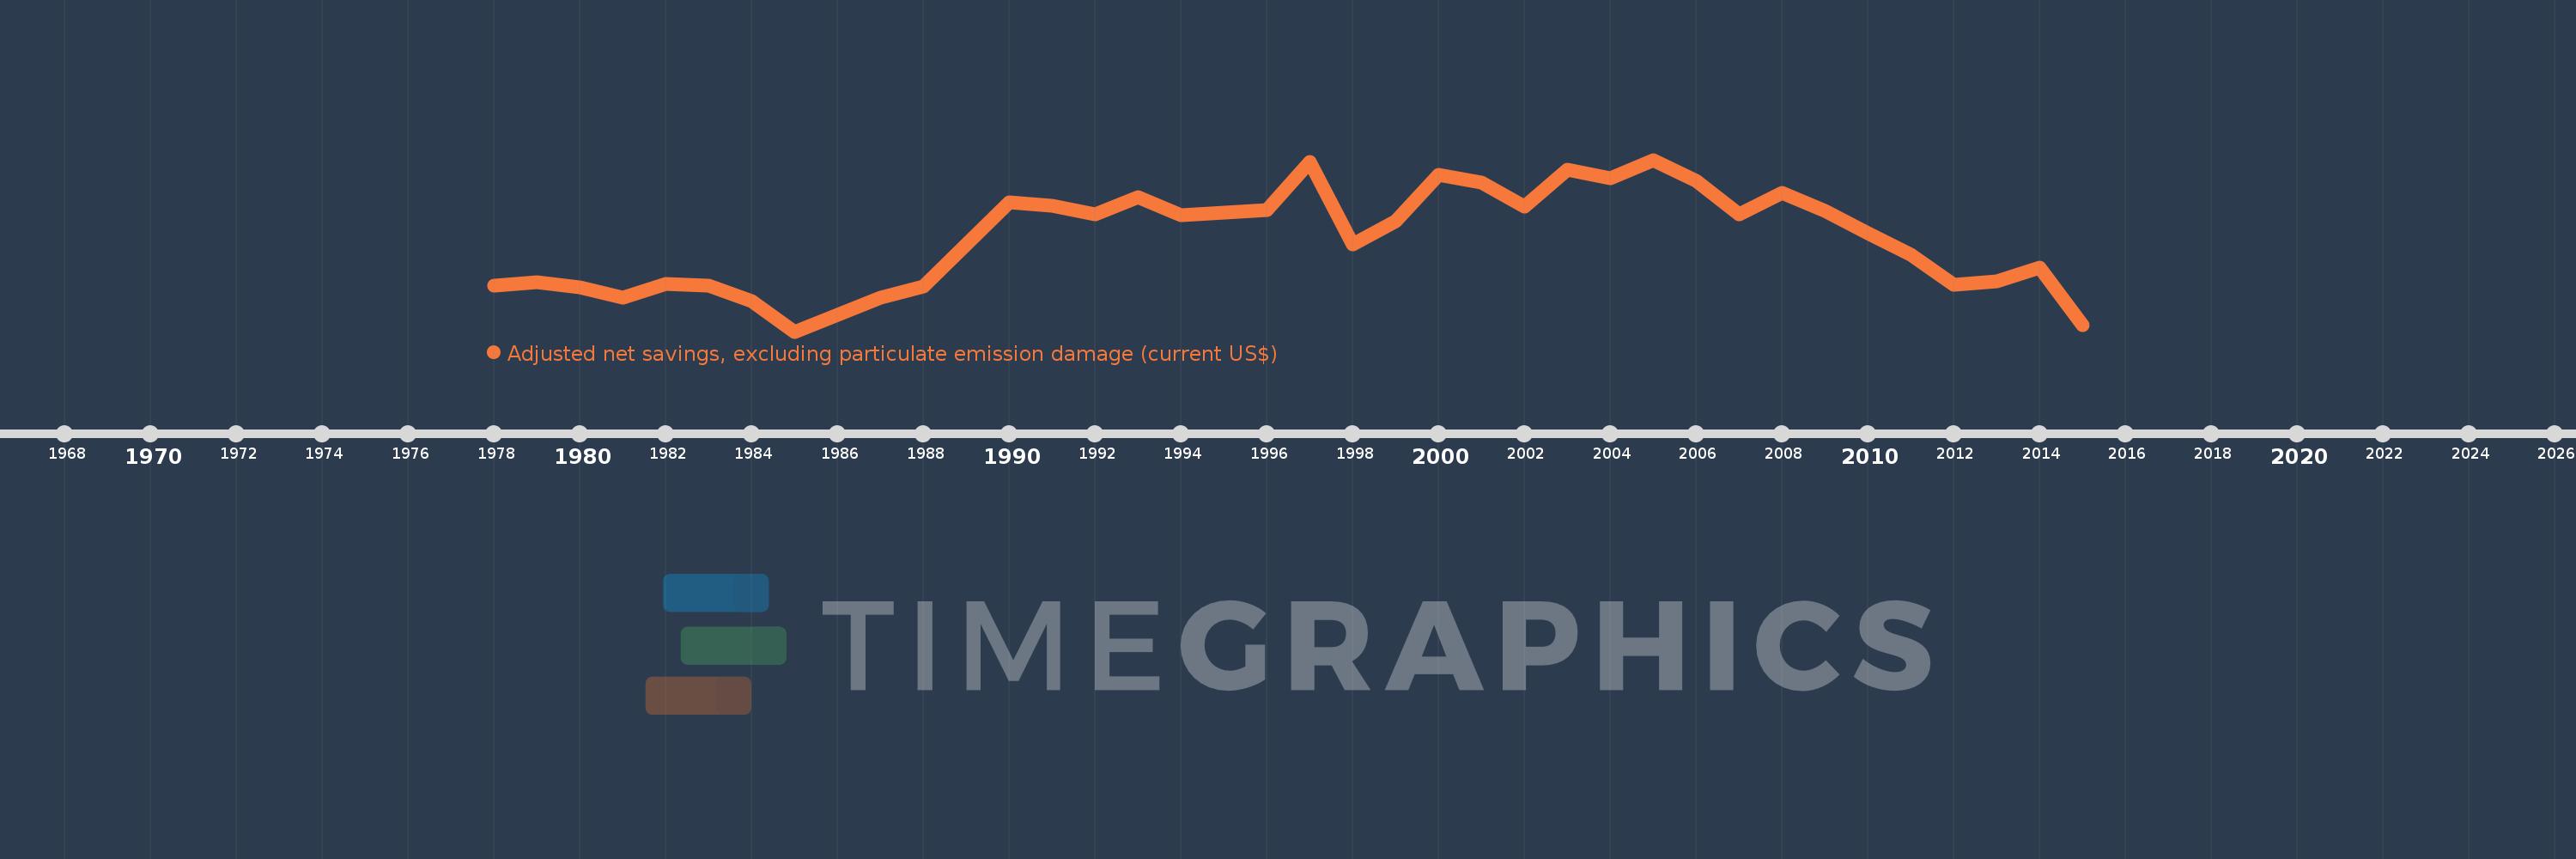
Adjusted net savings, excluding particulate emission damage (current US$)
2015,2014,2013,2012,2011,2010,2009,2008,2007,2006,2005,2004,2003,2002,2001,2000,1999,1998,1997,1996,1995,1994,1993,1992,1991,1990,1988,1987,1986,1985,1984,1983,1982,1981,1980,1979,1978
Cette statistique dans les autres pays:
AfghanistanAlbaniaAlgeriaAngolaArgentinaArmeniaAustraliaAustriaAzerbaijanBahamas, TheBahrainBangladeshBarbadosBelarusBelgiumBelizeBeninBhutanBoliviaBotswanaBrazilBrunei DarussalamBulgariaBurkina FasoBurundiCabo VerdeCambodiaCameroonCanadaCentral African RepublicChadChileChinaColombiaComorosCongo, Dem. Rep.Congo, Rep.Costa RicaCote d'IvoireCroatiaCyprusCzech RepublicDenmarkDjiboutiDominicaDominican RepublicEcuadorEgypt, Arab Rep.El SalvadorEquatorial GuineaEritreaEstoniaEthiopiaFijiFinlandFranceGabonGambia, TheGeorgiaGermanyGhanaGreeceGuatemalaGuineaGuinea-BissauGuyanaHaitiHondurasHungaryIcelandIndiaIndonesiaIran, Islamic Rep.IraqIrelandIsraelItalyJamaicaJapanJordanKazakhstanKenyaKiribatiKorea, Rep.KuwaitKyrgyz RepublicLao PDRLatviaLebanonLesothoLiberiaLibyaLithuaniaLuxembourgMacedonia, FYRMadagascarMalawiMalaysiaMaldivesMaliMauritaniaMauritiusMexicoMoldovaMongoliaMoroccoMozambiqueNamibiaNepalNetherlandsNew ZealandNicaraguaNigerNigeriaNorwayOmanPakistanPanamaPapua New GuineaParaguayPeruPhilippinesPolandPortugalQatarRomaniaRussian FederationRwandaSaudi ArabiaSenegalSeychellesSierra LeoneSingaporeSlovak RepublicSloveniaSolomon IslandsSouth AfricaSpainSri LankaSt. LuciaSt. Vincent and the GrenadinesSudanSurinameSwazilandSwedenSwitzerlandSyrian Arab RepublicTajikistanTanzaniaThailandTogoTongaTrinidad and TobagoTunisiaTurkeyUgandaUkraineUnited KingdomUnited StatesUruguayVanuatuVenezuela, RBVietnamYemen, Rep.ZambiaZimbabwe La ligne de temps
Cette échelle de temps montre un graphique de 1978 année à 2015 année Bahamas, The. Les données jusqu'à 1977 année ne sont pas présentés. Quantité d'observations actuelles selon dates: 37.
Source (désignation):
Les indicateurs du développement mondiale
Source (organisation):
World Bank staff estimates based on sources and methods in World Bank's "The Changing Wealth of Nations: Measuring Sustainable Development in the New Millennium" (2011).
Catégories:
Economy & Growth, Environment
Dernière mise à jour
23 avr. 2017
Les indicateurs de changement de valeurs selon les années
Minimum:
142.855 mln.
1 janv. 1985
Maximum:
1.585 mds
1 janv. 2005
Pour la date d''observation
Valeur
Changement absolu
Le changement par rapport à la valeur précédente
1 janv. 1978
527.403 mln.
+527.403 mln.
0.0%
1 janv. 1979
553.906 mln.
+26.503 mln.
5.03%
1 janv. 1980
513.205 mln.
-40.701 mln.
-7.35%
1 janv. 1981
424.891 mln.
-88.314 mln.
-17.21%
1 janv. 1982
539.562 mln.
+114.671 mln.
26.99%
1 janv. 1983
530.83 mln.
-8.732 mln.
-1.62%
1 janv. 1984
397.448 mln.
-133.382 mln.
-25.13%
1 janv. 1985
142.855 mln.
-254.593 mln.
-64.06%
1 janv. 1986
284.618 mln.
+141.763 mln.
99.24%
1 janv. 1987
430.389 mln.
+145.772 mln.
51.22%
1 janv. 1988
521.151 mln.
+90.762 mln.
21.09%
1 janv. 1990
1.226 mds
+704.52 mln.
135.19%
1 janv. 1991
1.2 mds
-25.909 mln.
-2.11%
1 janv. 1992
1.13 mds
-69.275 mln.
-5.77%
1 janv. 1993
1.269 mds
+138.131 mln.
12.22%
1 janv. 1994
1.117 mds
-151.318 mln.
-11.93%
1 janv. 1995
1.139 mds
+21.829 mln.
1.95%
1 janv. 1996
1.166 mds
+26.564 mln.
2.33%
1 janv. 1997
1.569 mds
+403.576 mln.
34.62%
1 janv. 1998
872.069 mln.
-697.201 mln.
-44.43%
1 janv. 1999
1.069 mds
+197.368 mln.
22.63%
1 janv. 2000
1.456 mds
+386.207 mln.
36.11%
1 janv. 2001
1.391 mds
-64.456 mln.
-4.43%
1 janv. 2002
1.191 mds
-200.216 mln.
-14.39%
1 janv. 2003
1.503 mds
+311.56 mln.
26.16%
1 janv. 2004
1.426 mds
-76.297 mln.
-5.08%
1 janv. 2005
1.585 mds
+158.424 mln.
11.11%
1 janv. 2006
1.407 mds
-177.796 mln.
-11.22%
1 janv. 2007
1.124 mds
-282.928 mln.
-20.11%
1 janv. 2008
1.305 mds
+180.766 mln.
16.08%
1 janv. 2009
1.156 mds
-149.037 mln.
-11.42%
1 janv. 2010
969.688 mln.
-185.976 mln.
-16.09%
1 janv. 2011
787.773 mln.
-181.915 mln.
-18.76%
1 janv. 2012
533.627 mln.
-254.146 mln.
-32.26%
1 janv. 2013
563.384 mln.
+29.757 mln.
5.58%
1 janv. 2014
676.985 mln.
+113.601 mln.
20.16%
1 janv. 2015
199.68 mln.
-477.304 mln.
-70.5%
Classement des pays selon les statistiques actuelles par années


Commentaires: