29
/fr/
fr
AIzaSyAYiBZKx7MnpbEhh9jyipgxe19OcubqV5w
April 1, 2024
219256
Papua New Guinea
PNG
true
2
1
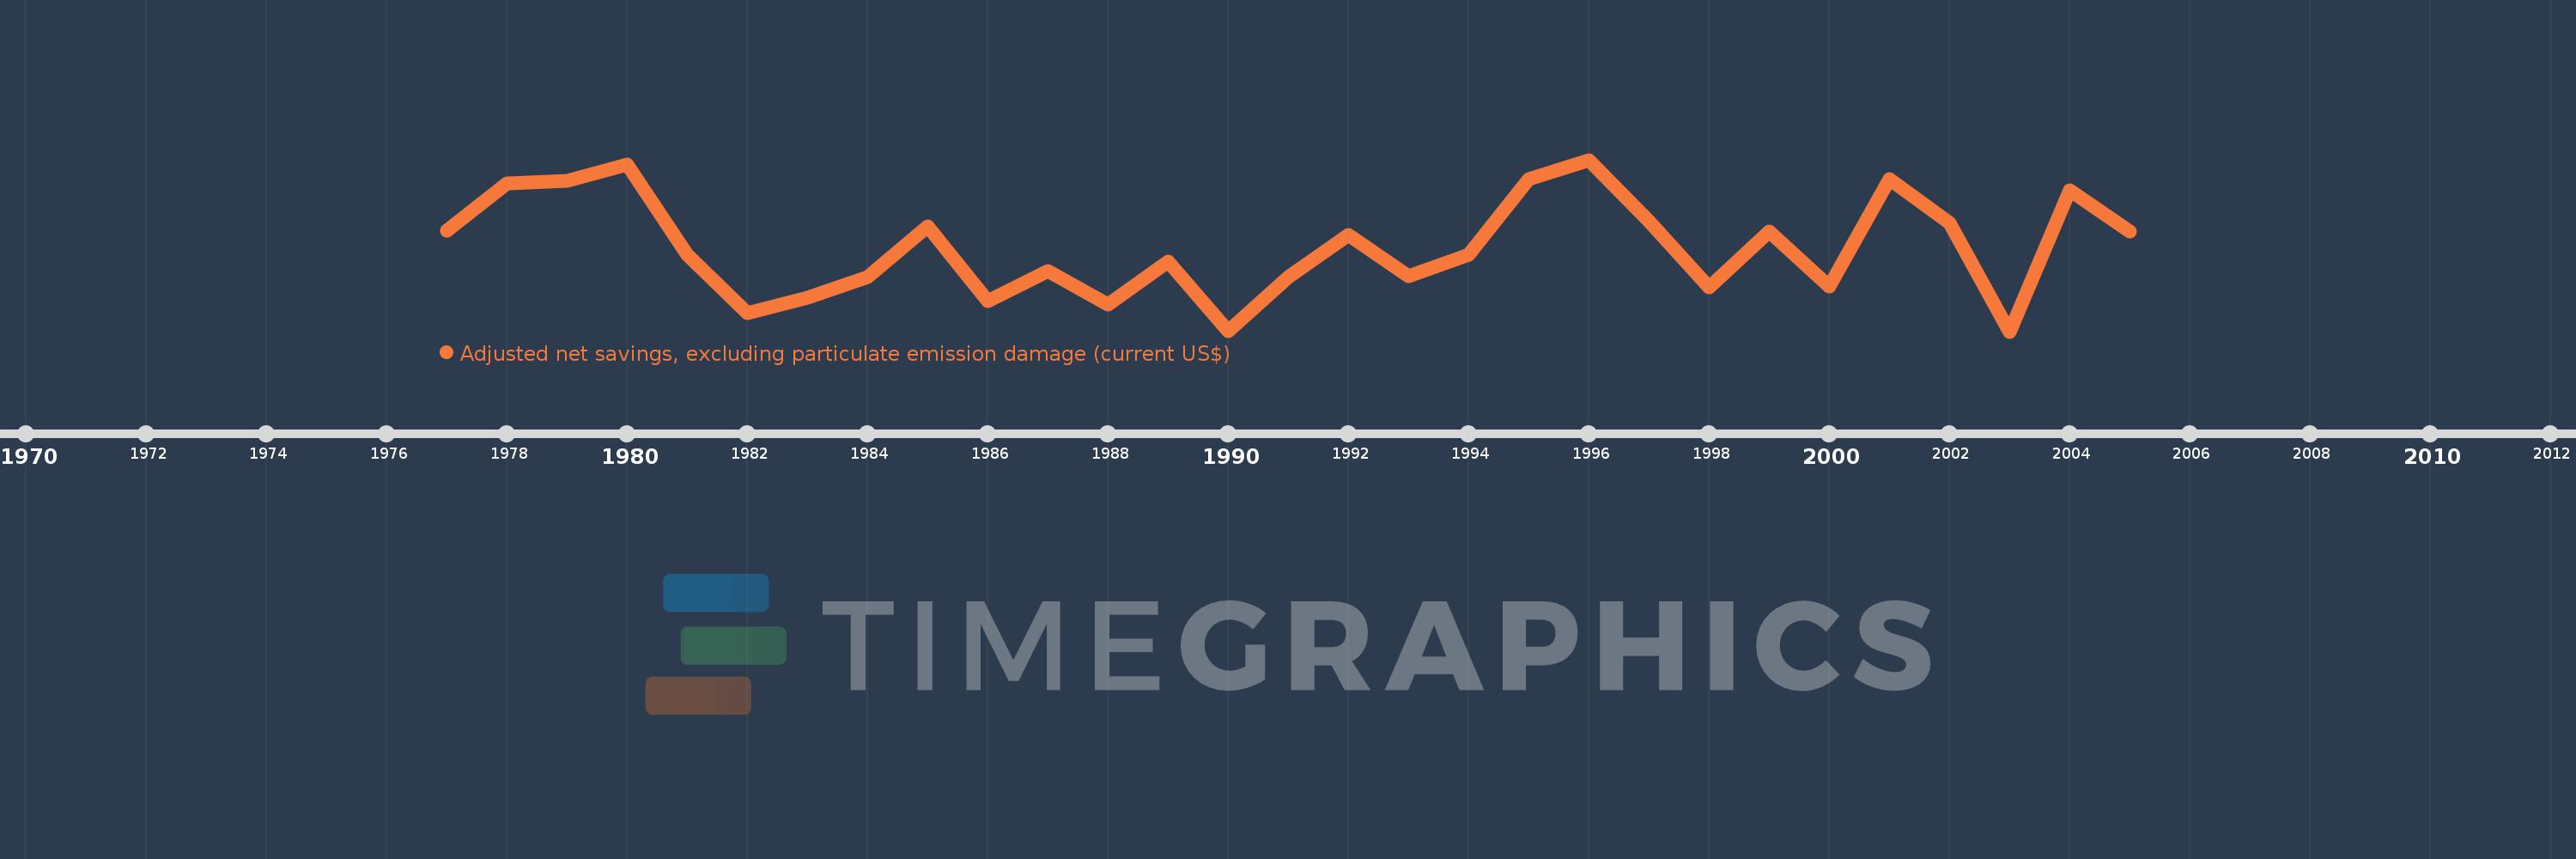
Adjusted net savings, excluding particulate emission damage (current US$)
2005,2004,2003,2002,2001,2000,1999,1998,1997,1996,1995,1994,1993,1992,1991,1990,1989,1988,1987,1986,1985,1984,1983,1982,1981,1980,1979,1978,1977
Cette statistique dans les autres pays:
AfghanistanAlbaniaAlgeriaAngolaArgentinaArmeniaAustraliaAustriaAzerbaijanBahamas, TheBahrainBangladeshBarbadosBelarusBelgiumBelizeBeninBhutanBoliviaBotswanaBrazilBrunei DarussalamBulgariaBurkina FasoBurundiCabo VerdeCambodiaCameroonCanadaCentral African RepublicChadChileChinaColombiaComorosCongo, Dem. Rep.Congo, Rep.Costa RicaCote d'IvoireCroatiaCyprusCzech RepublicDenmarkDjiboutiDominicaDominican RepublicEcuadorEgypt, Arab Rep.El SalvadorEquatorial GuineaEritreaEstoniaEthiopiaFijiFinlandFranceGabonGambia, TheGeorgiaGermanyGhanaGreeceGuatemalaGuineaGuinea-BissauGuyanaHaitiHondurasHungaryIcelandIndiaIndonesiaIran, Islamic Rep.IraqIrelandIsraelItalyJamaicaJapanJordanKazakhstanKenyaKiribatiKorea, Rep.KuwaitKyrgyz RepublicLao PDRLatviaLebanonLesothoLiberiaLibyaLithuaniaLuxembourgMacedonia, FYRMadagascarMalawiMalaysiaMaldivesMaliMauritaniaMauritiusMexicoMoldovaMongoliaMoroccoMozambiqueNamibiaNepalNetherlandsNew ZealandNicaraguaNigerNigeriaNorwayOmanPakistanPanamaPapua New GuineaParaguayPeruPhilippinesPolandPortugalQatarRomaniaRussian FederationRwandaSaudi ArabiaSenegalSeychellesSierra LeoneSingaporeSlovak RepublicSloveniaSolomon IslandsSouth AfricaSpainSri LankaSt. LuciaSt. Vincent and the GrenadinesSudanSurinameSwazilandSwedenSwitzerlandSyrian Arab RepublicTajikistanTanzaniaThailandTogoTongaTrinidad and TobagoTunisiaTurkeyUgandaUkraineUnited KingdomUnited StatesUruguayVanuatuVenezuela, RBVietnamYemen, Rep.ZambiaZimbabwe La ligne de temps
Cette échelle de temps montre un graphique de 1977 année à 2005 année Papua New Guinea. Les données jusqu'à 1976 année ne sont pas présentés. Quantité d'observations actuelles selon dates: 29.
Source (désignation):
Les indicateurs du développement mondiale
Source (organisation):
World Bank staff estimates based on sources and methods in World Bank's "The Changing Wealth of Nations: Measuring Sustainable Development in the New Millennium" (2011).
Catégories:
Economy & Growth, Environment
Dernière mise à jour
23 avr. 2017
Les indicateurs de changement de valeurs selon les années
Minimum:
-155.721 mln.
1 janv. 2003
Maximum:
410.707 mln.
1 janv. 1996
Pour la date d''observation
Valeur
Changement absolu
Le changement par rapport à la valeur précédente
1 janv. 1977
176.014 mln.
+176.014 mln.
0.0%
1 janv. 1978
331.713 mln.
+155.699 mln.
88.46%
1 janv. 1979
342.191 mln.
+10.478 mln.
3.16%
1 janv. 1980
396.077 mln.
+53.886 mln.
15.75%
1 janv. 1981
96.403 mln.
-299.673 mln.
-75.66%
1 janv. 1982
-95.096 mln.
-191.499 mln.
-198.64%
1 janv. 1983
-43.42 mln.
+51.676 mln.
-54.34%
1 janv. 1984
22.875 mln.
+66.295 mln.
-152.68%
1 janv. 1985
190.269 mln.
+167.394 mln.
731.76%
1 janv. 1986
-53.865 mln.
-244.134 mln.
-128.31%
1 janv. 1987
42.571 mln.
+96.436 mln.
-179.03%
1 janv. 1988
-65.116 mln.
-107.687 mln.
-252.96%
1 janv. 1989
73.853 mln.
+138.969 mln.
-213.42%
1 janv. 1990
-153.983 mln.
-227.836 mln.
-308.5%
1 janv. 1991
25.239 mln.
+179.222 mln.
-116.39%
1 janv. 1992
163.924 mln.
+138.684 mln.
549.48%
1 janv. 1993
26.927 mln.
-136.996 mln.
-83.57%
1 janv. 1994
96.467 mln.
+69.54 mln.
258.25%
1 janv. 1995
347.25 mln.
+250.783 mln.
259.97%
1 janv. 1996
410.707 mln.
+63.457 mln.
18.27%
1 janv. 1997
208.773 mln.
-201.934 mln.
-49.17%
1 janv. 1998
-10.595 mln.
-219.368 mln.
-105.07%
1 janv. 1999
174.183 mln.
+184.778 mln.
-1.74 milles%
1 janv. 2000
-7.0 mln.
-181.183 mln.
-104.02%
1 janv. 2001
345.965 mln.
+352.965 mln.
-5.04 milles%
1 janv. 2002
203.183 mln.
-142.782 mln.
-41.27%
1 janv. 2003
-155.721 mln.
-358.904 mln.
-176.64%
1 janv. 2004
310.931 mln.
+466.652 mln.
-299.67%
1 janv. 2005
173.396 mln.
-137.535 mln.
-44.23%
Classement des pays selon les statistiques actuelles par années


Commentaires: