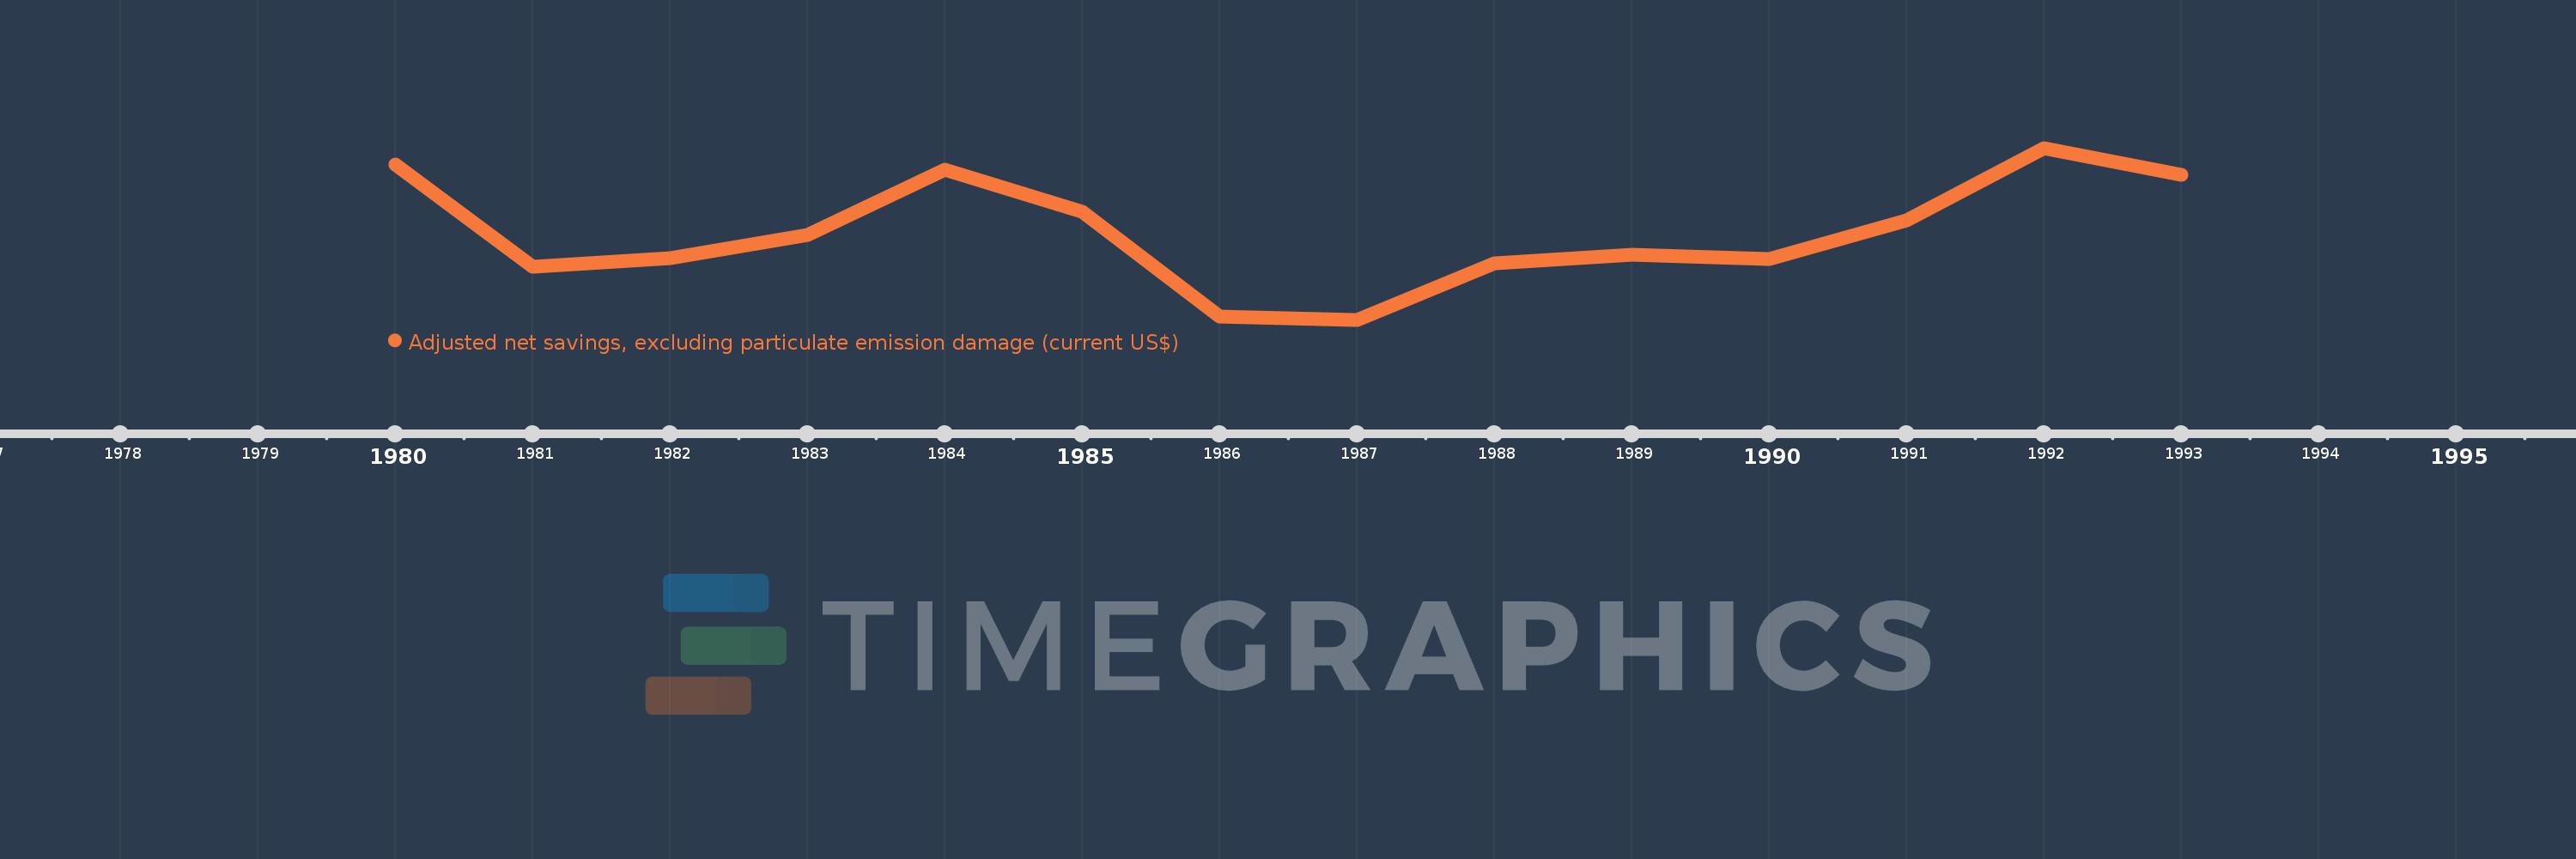
Cette échelle de temps montre un graphique de 1980 année à 1993 année Kiribati. Les données jusqu'à 1979 année ne sont pas présentés. Quantité d'observations actuelles selon dates: 14.
Source (désignation):
Les indicateurs du développement mondiale
Source (organisation):
World Bank staff estimates based on sources and methods in World Bank's "The Changing Wealth of Nations: Measuring Sustainable Development in the New Millennium" (2011).
Catégories:
Economy & Growth, Environment
Dernière mise à jour
23 avr. 2017
Les indicateurs de changement de valeurs selon les années
En moyenne:
16.058 mln.
Minimum:
5.256 mln.
1 janv. 1987
Maximum:
26.623 mln.
1 janv. 1992
Pour la date d''observation
Valeur
Changement absolu
Le changement par rapport à la valeur précédente
1 janv. 1980
24.535 mln.
+24.535 mln.
0.0%
1 janv. 1981
11.888 mln.
-12.647 mln.
-51.55%
1 janv. 1982
12.953 mln.
+1.065 mln.
8.96%
1 janv. 1983
15.844 mln.
+2.891 mln.
22.32%
1 janv. 1984
23.963 mln.
+8.12 mln.
51.25%
1 janv. 1985
18.687 mln.
-5.276 mln.
-22.02%
1 janv. 1986
5.644 mln.
-13.044 mln.
-69.8%
1 janv. 1987
5.256 mln.
-387.15 milles
-6.86%
1 janv. 1988
12.269 mln.
+7.012 mln.
133.41%
1 janv. 1989
13.379 mln.
+1.11 mln.
9.05%
1 janv. 1990
12.862 mln.
-516.471 milles
-3.86%
1 janv. 1991
17.571 mln.
+4.708 mln.
36.61%
1 janv. 1992
26.623 mln.
+9.052 mln.
51.52%
1 janv. 1993
23.332 mln.
-3.291 mln.
-12.36%
Classement des pays selon les statistiques actuelles par années
