29
/fr/
fr
AIzaSyAYiBZKx7MnpbEhh9jyipgxe19OcubqV5w
April 1, 2024
68325
Angola
AGO
true
2
1
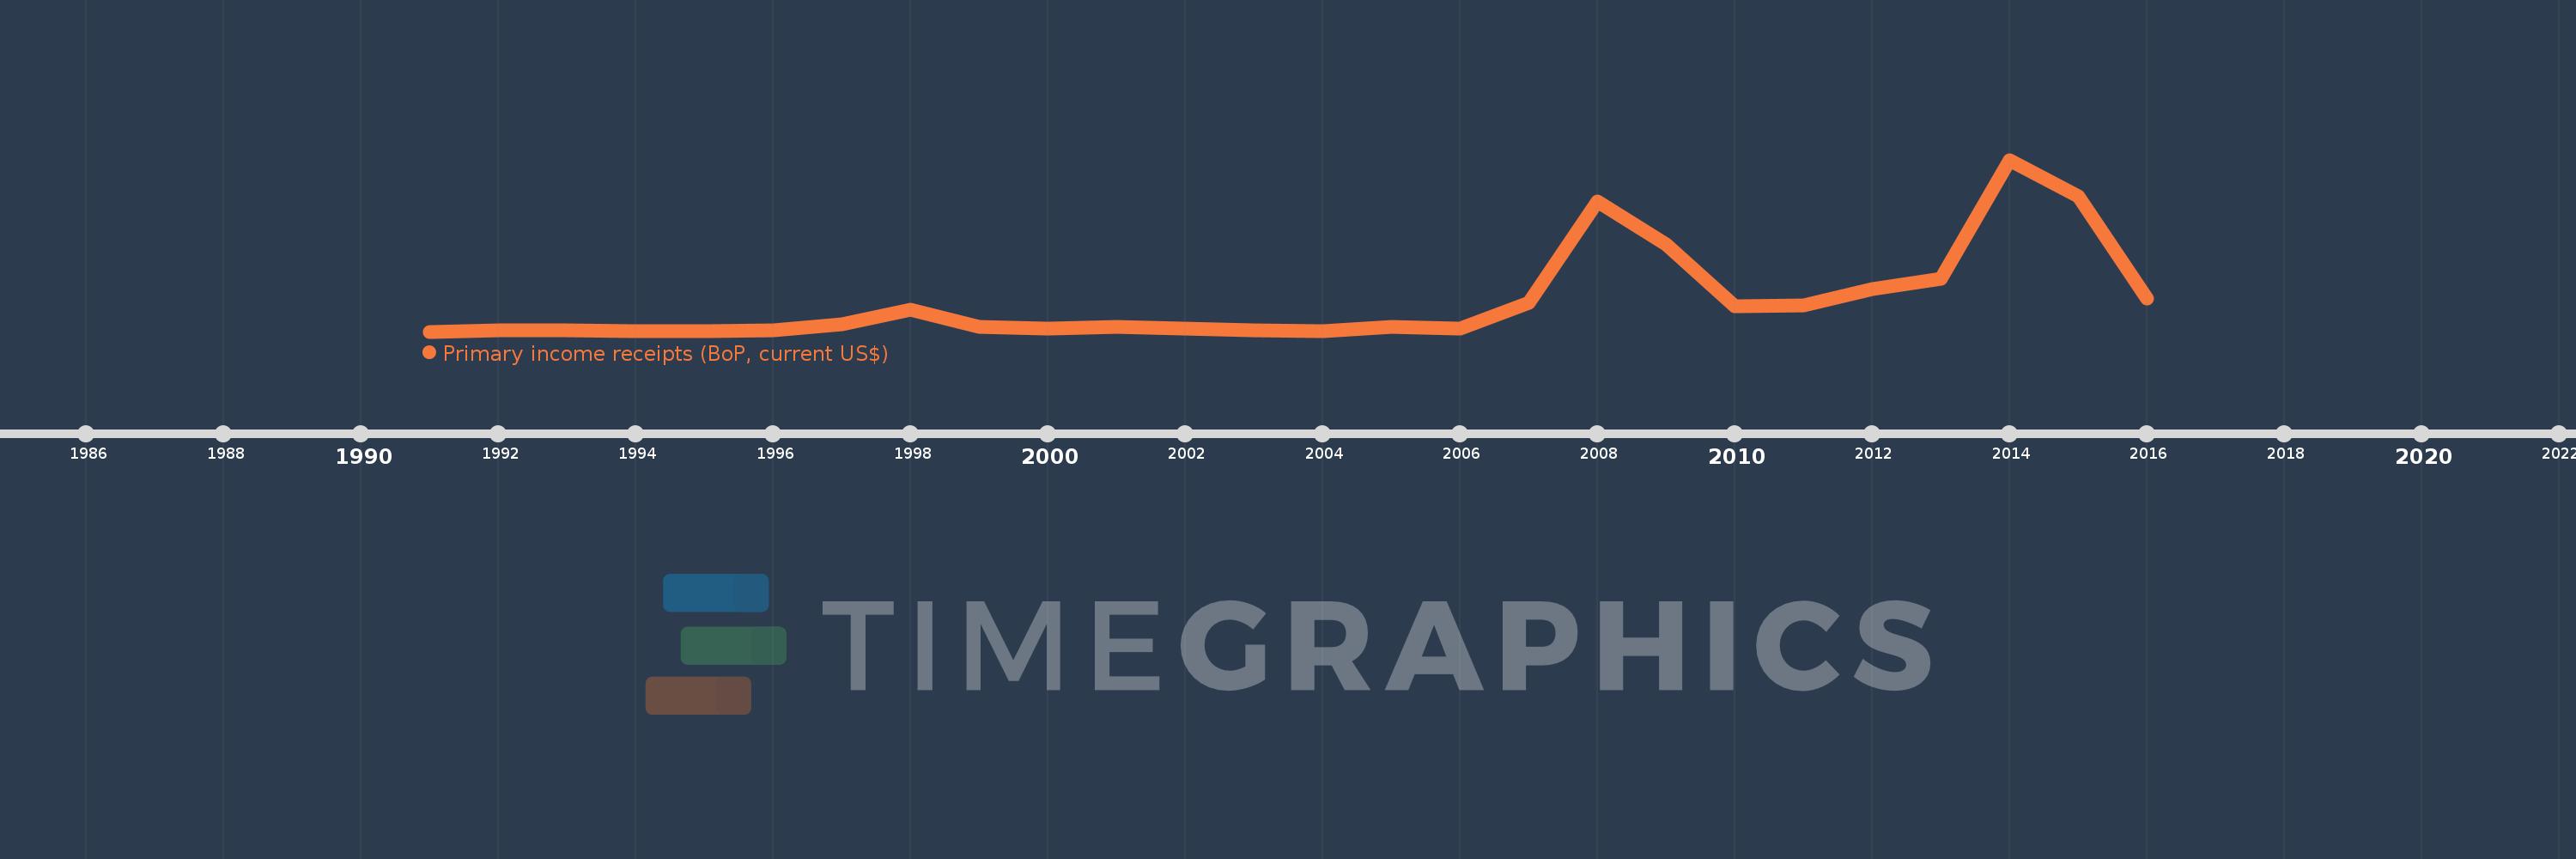
Primary income receipts (BoP, current US$)
2016,2015,2014,2013,2012,2011,2010,2009,2008,2007,2006,2005,2004,2003,2002,2001,2000,1999,1998,1997,1996,1995,1994,1993,1992,1991
Cette statistique dans les autres pays:
AfghanistanAlbaniaAlgeriaAngolaAntigua and BarbudaArab WorldArgentinaArmeniaArubaAustraliaAustriaAzerbaijanBahamas, TheBahrainBangladeshBarbadosBelarusBelgiumBelizeBeninBermudaBhutanBoliviaBosnia and HerzegovinaBotswanaBrazilBrunei DarussalamBulgariaBurkina FasoBurundiCabo VerdeCambodiaCameroonCanadaCaribbean small statesCentral African RepublicCentral Europe and the BalticsChadChileChinaColombiaComorosCongo, Dem. Rep.Congo, Rep.Costa RicaCote d'IvoireCroatiaCuracaoCyprusCzech RepublicDenmarkDjiboutiDominicaDominican RepublicEarly-demographic dividendEast Asia & PacificEast Asia & Pacific (excluding high income)East Asia & Pacific (IDA & IBRD countries)EcuadorEgypt, Arab Rep.El SalvadorEquatorial GuineaEritreaEstoniaEthiopiaEuro areaEurope & Central AsiaEurope & Central Asia (excluding high income)Europe & Central Asia (IDA & IBRD countries)European UnionFaroe IslandsFijiFinlandFragile and conflict affected situationsFranceFrench PolynesiaGabonGambia, TheGeorgiaGermanyGhanaGreeceGrenadaGuatemalaGuineaGuinea-BissauGuyanaHaitiHeavily indebted poor countries (HIPC)High incomeHondurasHong Kong SAR, ChinaHungaryIBRD onlyIcelandIDA & IBRD totalIDA blendIDA onlyIDA totalIndiaIndonesiaIran, Islamic Rep.IraqIrelandIsraelItalyJamaicaJapanJordanKazakhstanKenyaKiribatiKorea, Rep.KosovoKuwaitKyrgyz RepublicLao PDRLate-demographic dividendLatin America & Caribbean Latin America & Caribbean (excluding high income)Latin America & the Caribbean (IDA & IBRD countries)LatviaLeast developed countries: UN classificationLebanonLesothoLiberiaLibyaLithuaniaLow & middle incomeLow incomeLower middle incomeLuxembourgMacao SAR, ChinaMacedonia, FYRMadagascarMalawiMalaysiaMaldivesMaliMaltaMarshall IslandsMauritaniaMauritiusMexicoMicronesia, Fed. Sts.Middle East & North AfricaMiddle East & North Africa (excluding high income)Middle East & North Africa (IDA & IBRD countries)Middle incomeMoldovaMongoliaMontenegroMoroccoMozambiqueMyanmarNamibiaNepalNetherlandsNew CaledoniaNew ZealandNicaraguaNigerNigeriaNorth AmericaNorwayOECD membersOmanOther small statesPacific island small statesPakistanPalauPanamaPapua New GuineaParaguayPeruPhilippinesPolandPortugalPost-demographic dividendPre-demographic dividendQatarRomaniaRussian FederationRwandaSamoaSao Tome and PrincipeSaudi ArabiaSenegalSerbiaSeychellesSierra LeoneSingaporeSint Maarten (Dutch part)Slovak RepublicSloveniaSmall statesSolomon IslandsSouth AfricaSouth AsiaSouth Asia (IDA & IBRD)South SudanSpainSri LankaSt. Kitts and NevisSt. LuciaSt. Vincent and the GrenadinesSub-Saharan Africa Sub-Saharan Africa (excluding high income)Sub-Saharan Africa (IDA & IBRD countries)SudanSurinameSwazilandSwedenSwitzerlandSyrian Arab RepublicTajikistanTanzaniaThailandTimor-LesteTogoTongaTrinidad and TobagoTunisiaTurkeyTuvaluUgandaUkraineUnited KingdomUnited StatesUpper middle incomeUruguayVanuatuVenezuela, RBVietnamWest Bank and GazaWorldYemen, Rep.ZambiaZimbabwe La ligne de temps
Cette échelle de temps montre un graphique de 1991 année à 2016 année Angola. Les données jusqu'à 1990 année ne sont pas présentés. Quantité d'observations actuelles selon dates: 26.
Source (désignation):
Les indicateurs du développement mondiale
Source (organisation):
International Monetary Fund, Balance of Payments Statistics Yearbook and data files.
Catégories:
Economy & Growth
Dernière mise à jour
23 avr. 2017
Les indicateurs de changement de valeurs selon les années
Minimum:
10.6 mln.
1 janv. 1991
Maximum:
818.28 mln.
1 janv. 2014
Pour la date d''observation
Valeur
Changement absolu
Le changement par rapport à la valeur précédente
1 janv. 1991
10.6 mln.
+10.6 mln.
0.0%
1 janv. 1992
15.0 mln.
+4.4 mln.
41.51%
1 janv. 1993
15.692 mln.
+692.0 milles
4.61%
1 janv. 1994
11.3 mln.
-4.392 mln.
-27.99%
1 janv. 1995
13.0 mln.
+1.7 mln.
15.04%
1 janv. 1996
15.932 mln.
+2.932 mln.
22.55%
1 janv. 1997
43.34 mln.
+27.408 mln.
172.03%
1 janv. 1998
112.13 mln.
+68.79 mln.
158.72%
1 janv. 1999
34.47 mln.
-77.66 mln.
-69.26%
1 janv. 2000
24.14 mln.
-10.33 mln.
-29.97%
1 janv. 2001
34.37 mln.
+10.23 mln.
42.38%
1 janv. 2002
22.97 mln.
-11.4 mln.
-33.17%
1 janv. 2003
17.692 mln.
-5.278 mln.
-22.98%
1 janv. 2004
12.26 mln.
-5.432 mln.
-30.7%
1 janv. 2005
33.01 mln.
+20.75 mln.
169.25%
1 janv. 2006
25.751 mln.
-7.259 mln.
-21.99%
1 janv. 2007
145.048 mln.
+119.298 mln.
463.28%
1 janv. 2008
622.557 mln.
+477.509 mln.
329.21%
1 janv. 2009
422.299 mln.
-200.258 mln.
-32.17%
1 janv. 2010
131.333 mln.
-290.966 mln.
-68.9%
1 janv. 2011
134.034 mln.
+2.701 mln.
2.06%
1 janv. 2012
209.812 mln.
+75.778 mln.
56.54%
1 janv. 2013
259.82 mln.
+50.008 mln.
23.83%
1 janv. 2014
818.28 mln.
+558.459 mln.
214.94%
1 janv. 2015
645.563 mln.
-172.716 mln.
-21.11%
1 janv. 2016
166.354 mln.
-479.21 mln.
-74.23%
Classement des pays selon les statistiques actuelles par années


Commentaires: