29
/fr/
fr
AIzaSyAYiBZKx7MnpbEhh9jyipgxe19OcubqV5w
April 1, 2024
214720
Norway
NOR
true
2
1
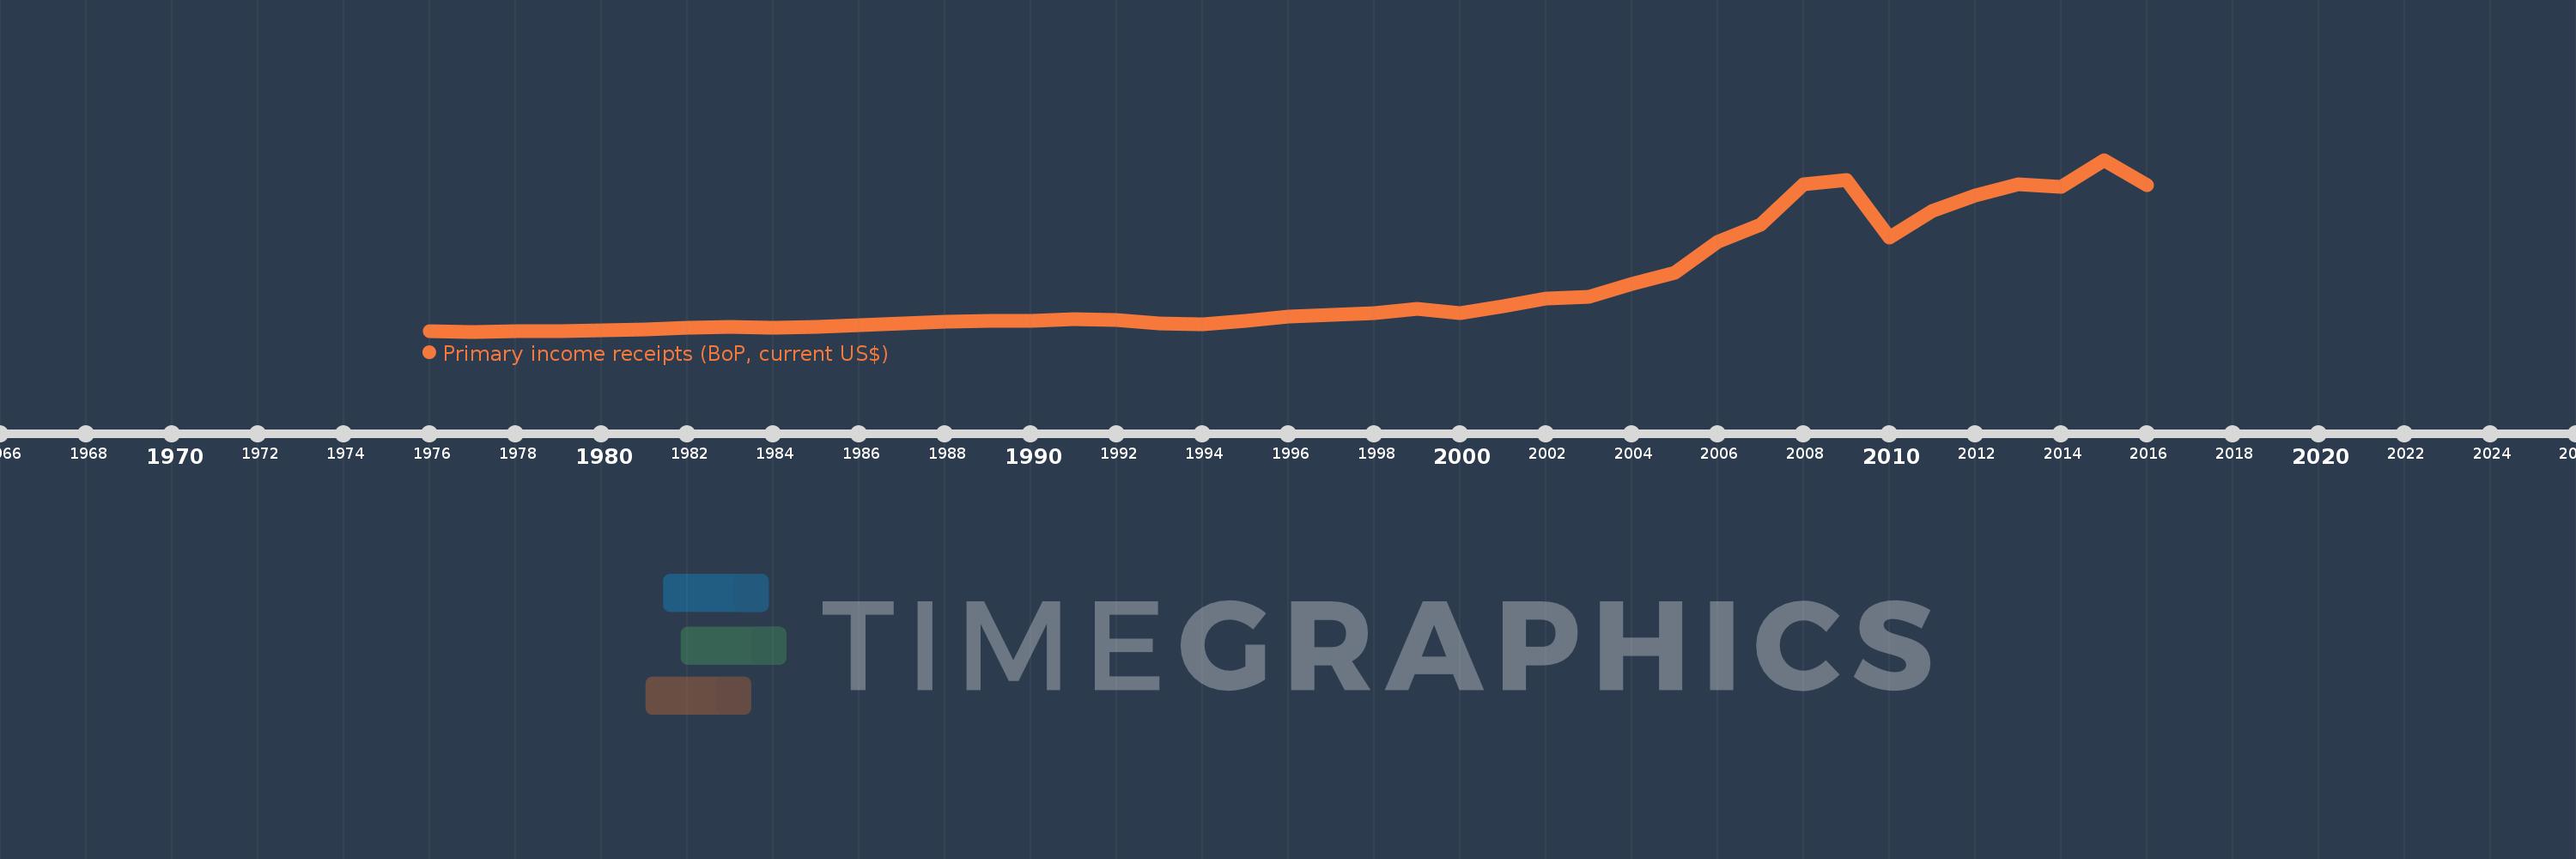
Primary income receipts (BoP, current US$)
2016,2015,2014,2013,2012,2011,2010,2009,2008,2007,2006,2005,2004,2003,2002,2001,2000,1999,1998,1997,1996,1995,1994,1993,1992,1991,1990,1989,1988,1987,1986,1985,1984,1983,1982,1981,1980,1979,1978,1977,1976
Cette statistique dans les autres pays:
AfghanistanAlbaniaAlgeriaAngolaAntigua and BarbudaArab WorldArgentinaArmeniaArubaAustraliaAustriaAzerbaijanBahamas, TheBahrainBangladeshBarbadosBelarusBelgiumBelizeBeninBermudaBhutanBoliviaBosnia and HerzegovinaBotswanaBrazilBrunei DarussalamBulgariaBurkina FasoBurundiCabo VerdeCambodiaCameroonCanadaCaribbean small statesCentral African RepublicCentral Europe and the BalticsChadChileChinaColombiaComorosCongo, Dem. Rep.Congo, Rep.Costa RicaCote d'IvoireCroatiaCuracaoCyprusCzech RepublicDenmarkDjiboutiDominicaDominican RepublicEarly-demographic dividendEast Asia & PacificEast Asia & Pacific (excluding high income)East Asia & Pacific (IDA & IBRD countries)EcuadorEgypt, Arab Rep.El SalvadorEquatorial GuineaEritreaEstoniaEthiopiaEuro areaEurope & Central AsiaEurope & Central Asia (excluding high income)Europe & Central Asia (IDA & IBRD countries)European UnionFaroe IslandsFijiFinlandFragile and conflict affected situationsFranceFrench PolynesiaGabonGambia, TheGeorgiaGermanyGhanaGreeceGrenadaGuatemalaGuineaGuinea-BissauGuyanaHaitiHeavily indebted poor countries (HIPC)High incomeHondurasHong Kong SAR, ChinaHungaryIBRD onlyIcelandIDA & IBRD totalIDA blendIDA onlyIDA totalIndiaIndonesiaIran, Islamic Rep.IraqIrelandIsraelItalyJamaicaJapanJordanKazakhstanKenyaKiribatiKorea, Rep.KosovoKuwaitKyrgyz RepublicLao PDRLate-demographic dividendLatin America & Caribbean Latin America & Caribbean (excluding high income)Latin America & the Caribbean (IDA & IBRD countries)LatviaLeast developed countries: UN classificationLebanonLesothoLiberiaLibyaLithuaniaLow & middle incomeLow incomeLower middle incomeLuxembourgMacao SAR, ChinaMacedonia, FYRMadagascarMalawiMalaysiaMaldivesMaliMaltaMarshall IslandsMauritaniaMauritiusMexicoMicronesia, Fed. Sts.Middle East & North AfricaMiddle East & North Africa (excluding high income)Middle East & North Africa (IDA & IBRD countries)Middle incomeMoldovaMongoliaMontenegroMoroccoMozambiqueMyanmarNamibiaNepalNetherlandsNew CaledoniaNew ZealandNicaraguaNigerNigeriaNorth AmericaNorwayOECD membersOmanOther small statesPacific island small statesPakistanPalauPanamaPapua New GuineaParaguayPeruPhilippinesPolandPortugalPost-demographic dividendPre-demographic dividendQatarRomaniaRussian FederationRwandaSamoaSao Tome and PrincipeSaudi ArabiaSenegalSerbiaSeychellesSierra LeoneSingaporeSint Maarten (Dutch part)Slovak RepublicSloveniaSmall statesSolomon IslandsSouth AfricaSouth AsiaSouth Asia (IDA & IBRD)South SudanSpainSri LankaSt. Kitts and NevisSt. LuciaSt. Vincent and the GrenadinesSub-Saharan Africa Sub-Saharan Africa (excluding high income)Sub-Saharan Africa (IDA & IBRD countries)SudanSurinameSwazilandSwedenSwitzerlandSyrian Arab RepublicTajikistanTanzaniaThailandTimor-LesteTogoTongaTrinidad and TobagoTunisiaTurkeyTuvaluUgandaUkraineUnited KingdomUnited StatesUpper middle incomeUruguayVanuatuVenezuela, RBVietnamWest Bank and GazaWorldYemen, Rep.ZambiaZimbabwe La ligne de temps
Cette échelle de temps montre un graphique de 1976 année à 2016 année Norway. Les données jusqu'à 1975 année ne sont pas présentés. Quantité d'observations actuelles selon dates: 41.
Source (désignation):
Les indicateurs du développement mondiale
Source (organisation):
International Monetary Fund, Balance of Payments Statistics Yearbook and data files.
Catégories:
Economy & Growth
Dernière mise à jour
23 avr. 2017
Les indicateurs de changement de valeurs selon les années
Minimum:
287.739 mln.
1 janv. 1977
Maximum:
49.597 mds
1 janv. 2015
Pour la date d''observation
Valeur
Changement absolu
Le changement par rapport à la valeur précédente
1 janv. 1976
312.551 mln.
+312.551 mln.
0.0%
1 janv. 1977
287.739 mln.
-24.812 mln.
-7.94%
1 janv. 1978
303.592 mln.
+15.853 mln.
5.51%
1 janv. 1979
406.978 mln.
+103.386 mln.
34.05%
1 janv. 1980
597.133 mln.
+190.154 mln.
46.72%
1 janv. 1981
987.586 mln.
+390.453 mln.
65.39%
1 janv. 1982
1.442 mds
+454.912 mln.
46.06%
1 janv. 1983
1.63 mds
+187.53 mln.
13.0%
1 janv. 1984
1.379 mds
-251.268 mln.
-15.41%
1 janv. 1985
1.615 mds
+236.635 mln.
17.16%
1 janv. 1986
2.1 mds
+484.281 mln.
29.98%
1 janv. 1987
2.722 mds
+622.176 mln.
29.63%
1 janv. 1988
3.038 mds
+316.591 mln.
11.63%
1 janv. 1989
3.264 mds
+225.539 mln.
7.42%
1 janv. 1990
3.428 mds
+164.024 mln.
5.03%
1 janv. 1991
3.895 mds
+467.121 mln.
13.63%
1 janv. 1992
3.533 mds
-361.708 mln.
-9.29%
1 janv. 1993
2.689 mds
-844.064 mln.
-23.89%
1 janv. 1994
2.38 mds
-309.641 mln.
-11.51%
1 janv. 1995
3.415 mds
+1.035 mds
43.48%
1 janv. 1996
4.59 mds
+1.176 mds
34.44%
1 janv. 1997
5.164 mds
+573.835 mln.
12.5%
1 janv. 1998
5.59 mds
+425.359 mln.
8.24%
1 janv. 1999
6.809 mds
+1.219 mds
21.81%
1 janv. 2000
5.541 mds
-1.268 mds
-18.62%
1 janv. 2001
7.546 mds
+2.005 mds
36.19%
1 janv. 2002
9.671 mds
+2.125 mds
28.16%
1 janv. 2003
10.351 mds
+680.251 mln.
7.03%
1 janv. 2004
14.077 mds
+3.726 mds
36.0%
1 janv. 2005
17.117 mds
+3.04 mds
21.59%
1 janv. 2006
26.124 mds
+9.006 mds
52.62%
1 janv. 2007
30.936 mds
+4.812 mds
18.42%
1 janv. 2008
42.549 mds
+11.614 mds
37.54%
1 janv. 2009
43.884 mds
+1.334 mds
3.14%
1 janv. 2010
27.292 mds
-16.592 mds
-37.81%
1 janv. 2011
34.999 mds
+7.707 mds
28.24%
1 janv. 2012
39.279 mds
+4.28 mds
12.23%
1 janv. 2013
42.55 mds
+3.271 mds
8.33%
1 janv. 2014
41.752 mds
-797.991 mln.
-1.88%
1 janv. 2015
49.597 mds
+7.845 mds
18.79%
1 janv. 2016
42.249 mds
-7.348 mds
-14.82%
Classement des pays selon les statistiques actuelles par années


Commentaires: