29
/fr/
fr
AIzaSyAYiBZKx7MnpbEhh9jyipgxe19OcubqV5w
April 1, 2024
212304
Niger
NER
true
2
1
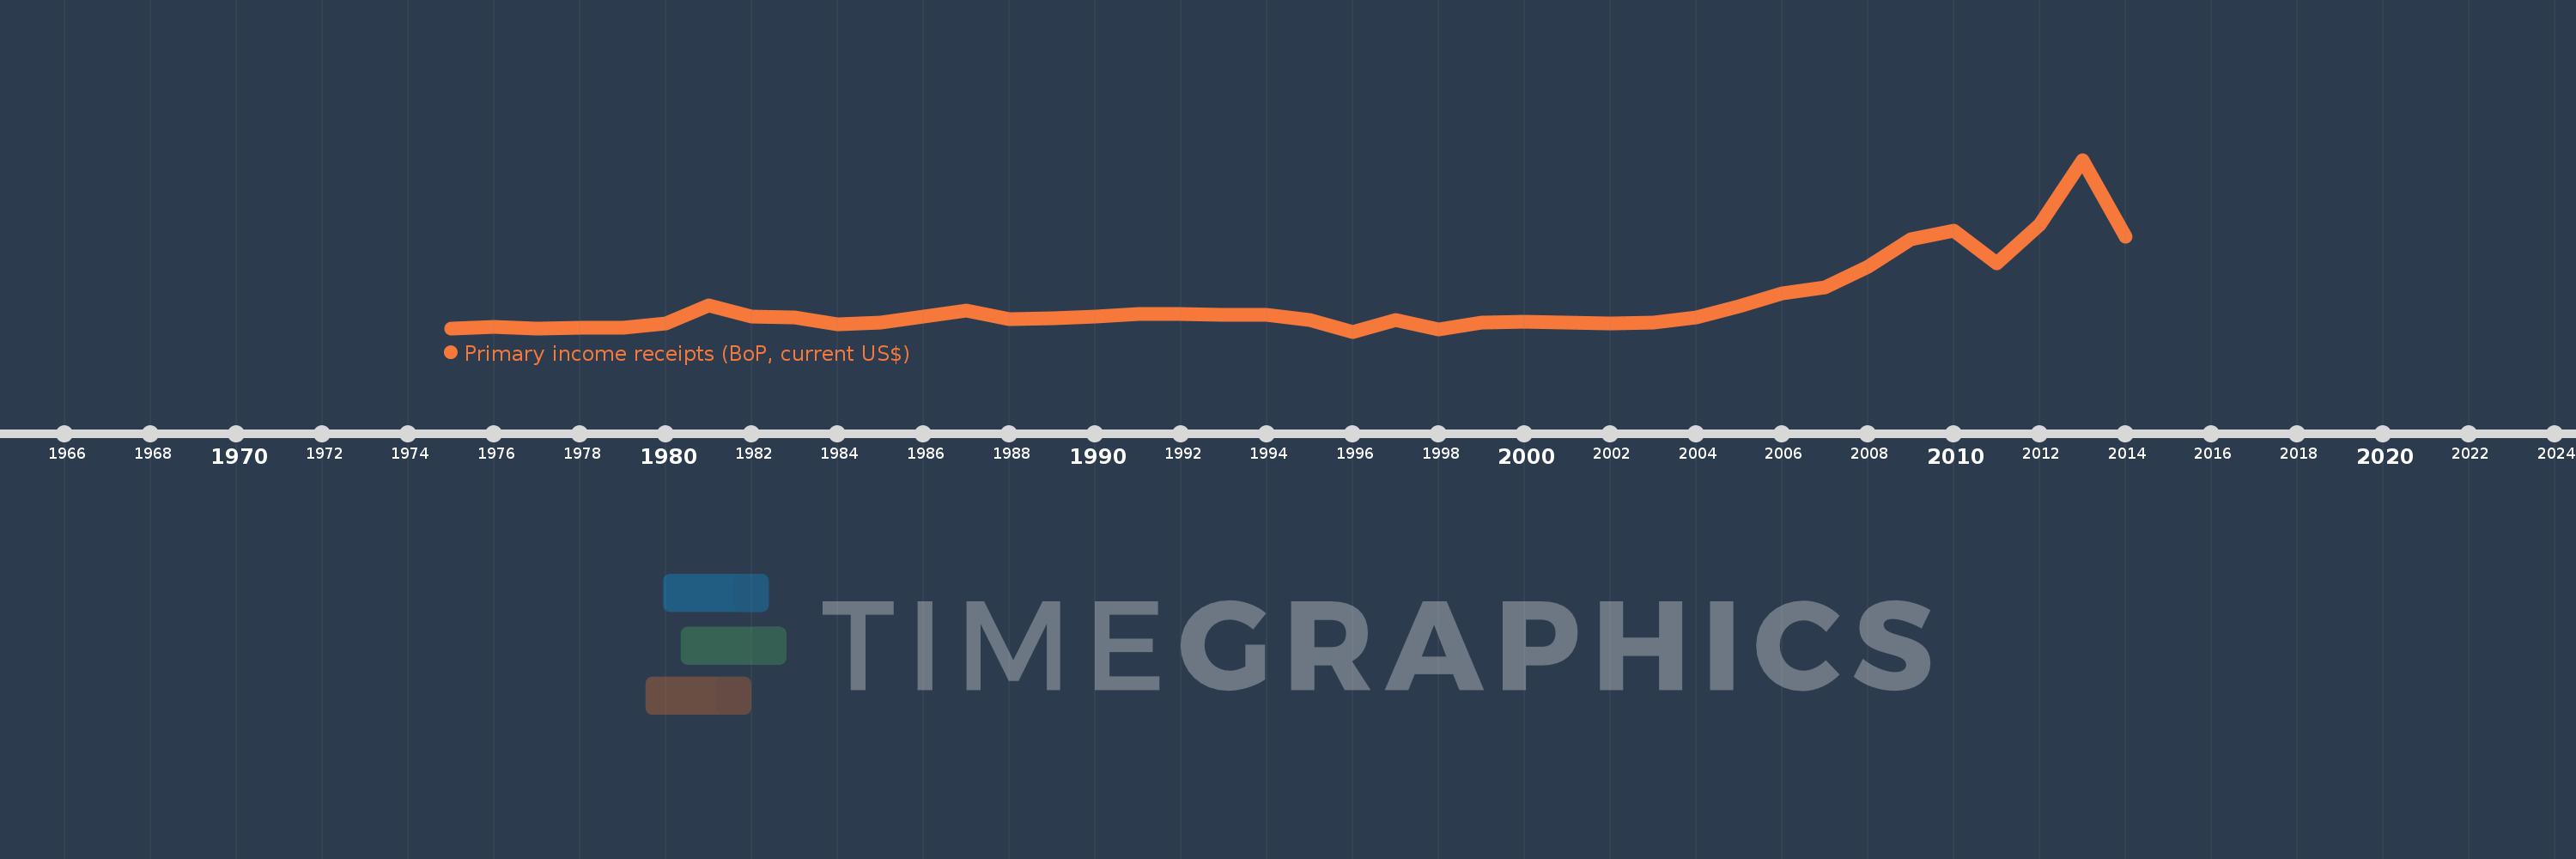
Primary income receipts (BoP, current US$)
2014,2013,2012,2011,2010,2009,2008,2007,2006,2005,2004,2003,2002,2001,2000,1999,1998,1997,1996,1995,1994,1993,1992,1991,1990,1989,1988,1987,1986,1985,1984,1983,1982,1981,1980,1979,1978,1977,1976,1975
Cette statistique dans les autres pays:
AfghanistanAlbaniaAlgeriaAngolaAntigua and BarbudaArab WorldArgentinaArmeniaArubaAustraliaAustriaAzerbaijanBahamas, TheBahrainBangladeshBarbadosBelarusBelgiumBelizeBeninBermudaBhutanBoliviaBosnia and HerzegovinaBotswanaBrazilBrunei DarussalamBulgariaBurkina FasoBurundiCabo VerdeCambodiaCameroonCanadaCaribbean small statesCentral African RepublicCentral Europe and the BalticsChadChileChinaColombiaComorosCongo, Dem. Rep.Congo, Rep.Costa RicaCote d'IvoireCroatiaCuracaoCyprusCzech RepublicDenmarkDjiboutiDominicaDominican RepublicEarly-demographic dividendEast Asia & PacificEast Asia & Pacific (excluding high income)East Asia & Pacific (IDA & IBRD countries)EcuadorEgypt, Arab Rep.El SalvadorEquatorial GuineaEritreaEstoniaEthiopiaEuro areaEurope & Central AsiaEurope & Central Asia (excluding high income)Europe & Central Asia (IDA & IBRD countries)European UnionFaroe IslandsFijiFinlandFragile and conflict affected situationsFranceFrench PolynesiaGabonGambia, TheGeorgiaGermanyGhanaGreeceGrenadaGuatemalaGuineaGuinea-BissauGuyanaHaitiHeavily indebted poor countries (HIPC)High incomeHondurasHong Kong SAR, ChinaHungaryIBRD onlyIcelandIDA & IBRD totalIDA blendIDA onlyIDA totalIndiaIndonesiaIran, Islamic Rep.IraqIrelandIsraelItalyJamaicaJapanJordanKazakhstanKenyaKiribatiKorea, Rep.KosovoKuwaitKyrgyz RepublicLao PDRLate-demographic dividendLatin America & Caribbean Latin America & Caribbean (excluding high income)Latin America & the Caribbean (IDA & IBRD countries)LatviaLeast developed countries: UN classificationLebanonLesothoLiberiaLibyaLithuaniaLow & middle incomeLow incomeLower middle incomeLuxembourgMacao SAR, ChinaMacedonia, FYRMadagascarMalawiMalaysiaMaldivesMaliMaltaMarshall IslandsMauritaniaMauritiusMexicoMicronesia, Fed. Sts.Middle East & North AfricaMiddle East & North Africa (excluding high income)Middle East & North Africa (IDA & IBRD countries)Middle incomeMoldovaMongoliaMontenegroMoroccoMozambiqueMyanmarNamibiaNepalNetherlandsNew CaledoniaNew ZealandNicaraguaNigerNigeriaNorth AmericaNorwayOECD membersOmanOther small statesPacific island small statesPakistanPalauPanamaPapua New GuineaParaguayPeruPhilippinesPolandPortugalPost-demographic dividendPre-demographic dividendQatarRomaniaRussian FederationRwandaSamoaSao Tome and PrincipeSaudi ArabiaSenegalSerbiaSeychellesSierra LeoneSingaporeSint Maarten (Dutch part)Slovak RepublicSloveniaSmall statesSolomon IslandsSouth AfricaSouth AsiaSouth Asia (IDA & IBRD)South SudanSpainSri LankaSt. Kitts and NevisSt. LuciaSt. Vincent and the GrenadinesSub-Saharan Africa Sub-Saharan Africa (excluding high income)Sub-Saharan Africa (IDA & IBRD countries)SudanSurinameSwazilandSwedenSwitzerlandSyrian Arab RepublicTajikistanTanzaniaThailandTimor-LesteTogoTongaTrinidad and TobagoTunisiaTurkeyTuvaluUgandaUkraineUnited KingdomUnited StatesUpper middle incomeUruguayVanuatuVenezuela, RBVietnamWest Bank and GazaWorldYemen, Rep.ZambiaZimbabwe La ligne de temps
Cette échelle de temps montre un graphique de 1975 année à 2014 année Niger. Les données jusqu'à 1974 année ne sont pas présentés. Quantité d'observations actuelles selon dates: 40.
Source (désignation):
Les indicateurs du développement mondiale
Source (organisation):
International Monetary Fund, Balance of Payments Statistics Yearbook and data files.
Catégories:
Economy & Growth
Dernière mise à jour
23 avr. 2017
Les indicateurs de changement de valeurs selon les années
Minimum:
5.79 mln.
1 janv. 1996
Maximum:
146.96 mln.
1 janv. 2013
Pour la date d''observation
Valeur
Changement absolu
Le changement par rapport à la valeur précédente
1 janv. 1975
8.197 mln.
+8.197 mln.
0.0%
1 janv. 1976
9.705 mln.
+1.509 mln.
18.41%
1 janv. 1977
8.06 mln.
-1.645 mln.
-16.95%
1 janv. 1978
8.983 mln.
+922.995 milles
11.45%
1 janv. 1979
9.284 mln.
+300.807 milles
3.35%
1 janv. 1980
12.429 mln.
+3.145 mln.
33.88%
1 janv. 1981
27.012 mln.
+14.582 mln.
117.32%
1 janv. 1982
18.202 mln.
-8.81 mln.
-32.61%
1 janv. 1983
17.599 mln.
-603.225 milles
-3.31%
1 janv. 1984
11.94 mln.
-5.658 mln.
-32.15%
1 janv. 1985
13.464 mln.
+1.523 mln.
12.76%
1 janv. 1986
18.401 mln.
+4.938 mln.
36.67%
1 janv. 1987
22.89 mln.
+4.489 mln.
24.39%
1 janv. 1988
15.675 mln.
-7.215 mln.
-31.52%
1 janv. 1989
16.72 mln.
+1.045 mln.
6.66%
1 janv. 1990
18.006 mln.
+1.286 mln.
7.69%
1 janv. 1991
20.359 mln.
+2.353 mln.
13.07%
1 janv. 1992
20.12 mln.
-238.826 milles
-1.17%
1 janv. 1993
19.653 mln.
-466.986 milles
-2.32%
1 janv. 1994
19.332 mln.
-321.395 milles
-1.64%
1 janv. 1995
15.603 mln.
-3.728 mln.
-19.29%
1 janv. 1996
5.79 mln.
-9.813 mln.
-62.89%
1 janv. 1997
15.521 mln.
+9.732 mln.
168.08%
1 janv. 1998
7.717 mln.
-7.805 mln.
-50.28%
1 janv. 1999
12.984 mln.
+5.267 mln.
68.26%
1 janv. 2000
14.005 mln.
+1.021 mln.
7.86%
1 janv. 2001
13.061 mln.
-944.389 milles
-6.74%
1 janv. 2002
12.305 mln.
-755.881 milles
-5.79%
1 janv. 2003
13.25 mln.
+944.919 milles
7.68%
1 janv. 2004
17.256 mln.
+4.006 mln.
30.23%
1 janv. 2005
26.474 mln.
+9.219 mln.
53.42%
1 janv. 2006
37.064 mln.
+10.589 mln.
40.0%
1 janv. 2007
41.984 mln.
+4.92 mln.
13.27%
1 janv. 2008
59.186 mln.
+17.202 mln.
40.97%
1 janv. 2009
81.337 mln.
+22.15 mln.
37.43%
1 janv. 2010
88.942 mln.
+7.605 mln.
9.35%
1 janv. 2011
61.691 mln.
-27.251 mln.
-30.64%
1 janv. 2012
93.73 mln.
+32.039 mln.
51.94%
1 janv. 2013
146.96 mln.
+53.23 mln.
56.79%
1 janv. 2014
83.908 mln.
-63.052 mln.
-42.9%
Classement des pays selon les statistiques actuelles par années


Commentaires: