29
/fr/
fr
AIzaSyAYiBZKx7MnpbEhh9jyipgxe19OcubqV5w
April 1, 2024
66279
Algeria
DZA
true
2
1
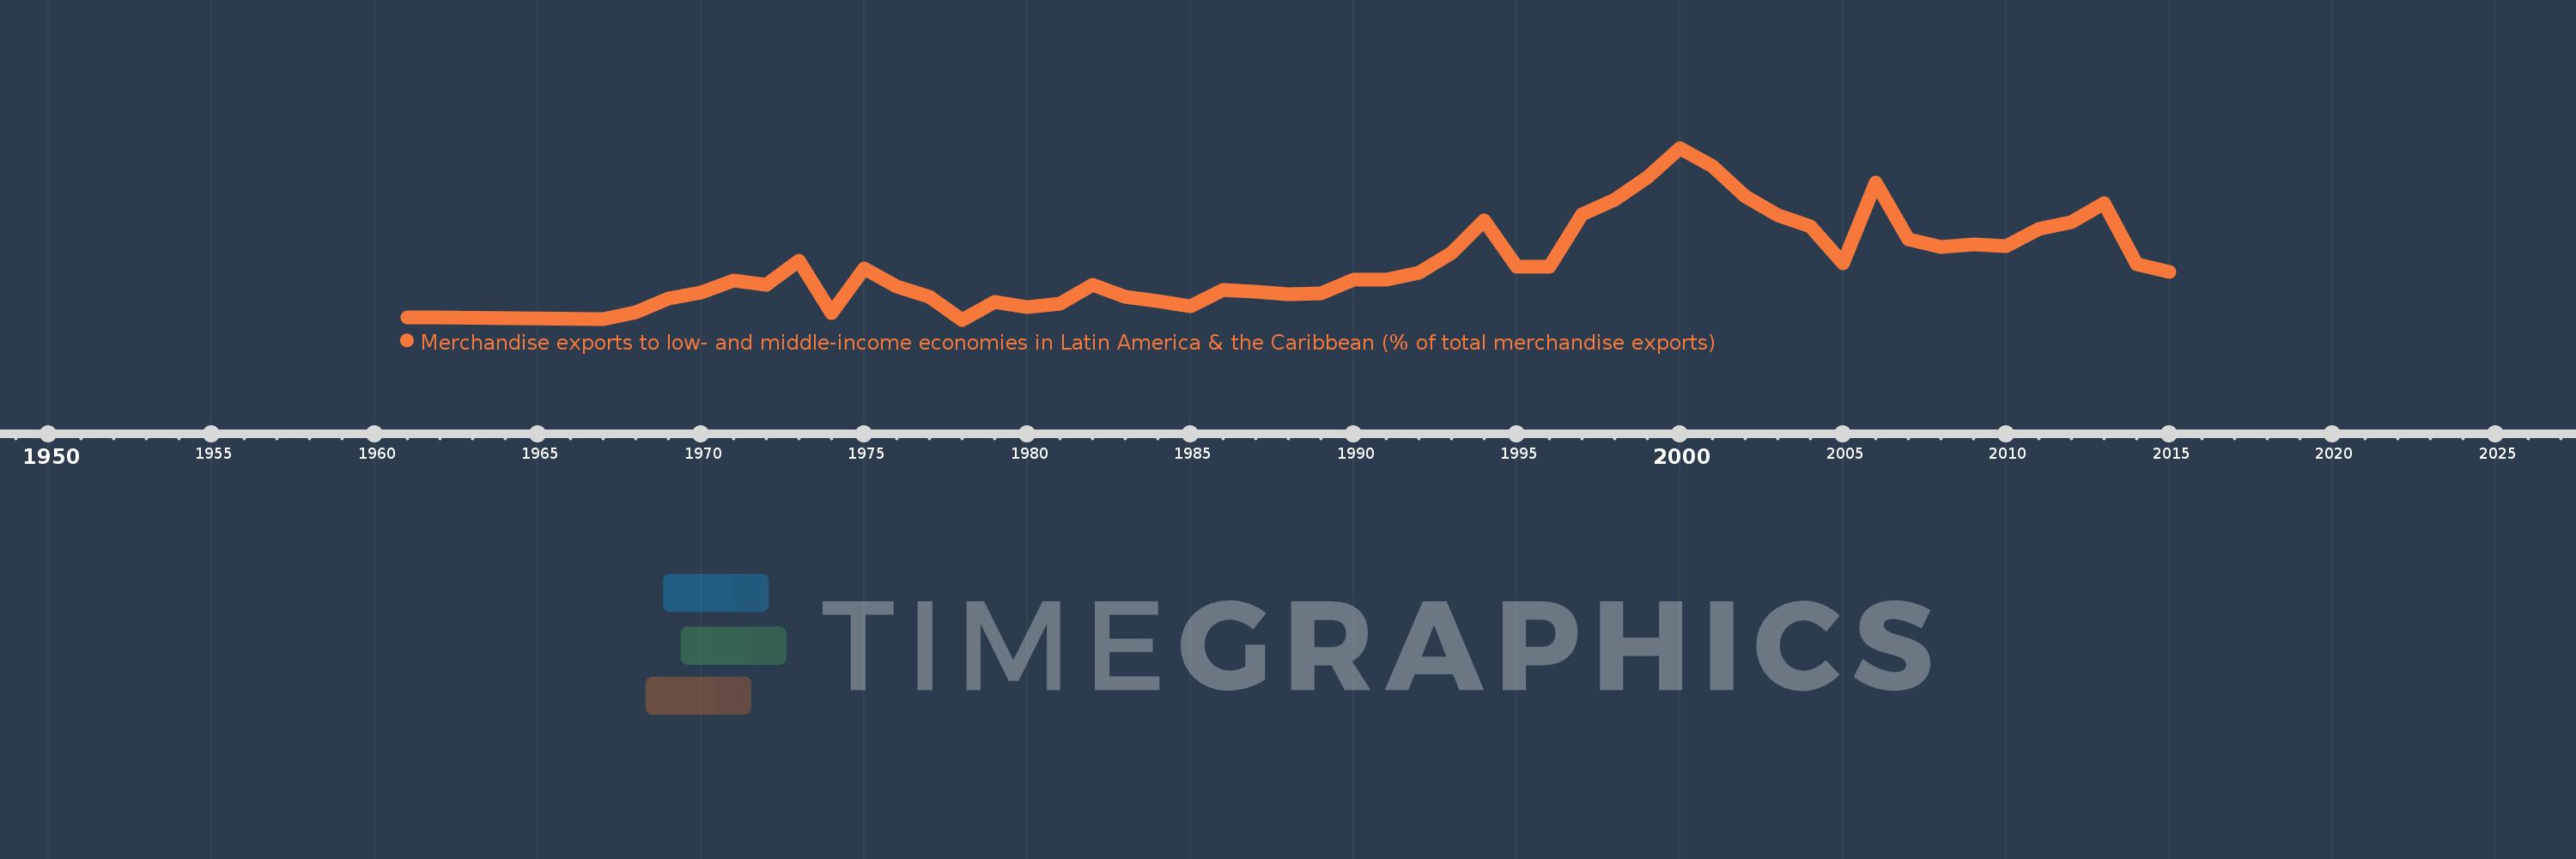
Merchandise exports to low- and middle-income economies in Latin America & the Caribbean (% of total merchandise exports)
2015,2014,2013,2012,2011,2010,2009,2008,2007,2006,2005,2004,2003,2002,2001,2000,1999,1998,1997,1996,1995,1994,1993,1992,1991,1990,1989,1988,1987,1986,1985,1984,1983,1982,1981,1980,1979,1978,1977,1976,1975,1974,1973,1972,1971,1970,1969,1968,1967,1962,1961
Cette statistique dans les autres pays:
AfghanistanAlbaniaAlgeriaAngolaAntigua and BarbudaArab WorldArgentinaArmeniaArubaAustraliaAustriaAzerbaijanBahamas, TheBahrainBangladeshBarbadosBelarusBelgiumBelizeBeninBermudaBoliviaBrazilBrunei DarussalamBulgariaBurundiCabo VerdeCambodiaCameroonCanadaCaribbean small statesCentral African RepublicCentral Europe and the BalticsChileChinaColombiaCongo, Dem. Rep.Congo, Rep.Costa RicaCote d'IvoireCroatiaCubaCyprusCzech RepublicDenmarkDominicaDominican RepublicEarly-demographic dividendEast Asia & PacificEast Asia & Pacific (excluding high income)East Asia & Pacific (IDA & IBRD countries)EcuadorEgypt, Arab Rep.El SalvadorEstoniaEthiopiaEuro areaEurope & Central AsiaEurope & Central Asia (excluding high income)Europe & Central Asia (IDA & IBRD countries)European UnionFaroe IslandsFijiFinlandFragile and conflict affected situationsFranceFrench PolynesiaGabonGambia, TheGeorgiaGermanyGhanaGibraltarGreeceGreenlandGrenadaGuatemalaGuineaGuyanaHaitiHeavily indebted poor countries (HIPC)High incomeHondurasHong Kong SAR, ChinaHungaryIBRD onlyIcelandIDA & IBRD totalIDA blendIDA onlyIDA totalIndiaIndonesiaIran, Islamic Rep.IraqIrelandIsraelItalyJamaicaJapanJordanKazakhstanKenyaKorea, Dem. People’s Rep.Korea, Rep.KuwaitLao PDRLate-demographic dividendLatin America & Caribbean Latin America & Caribbean (excluding high income)Latin America & the Caribbean (IDA & IBRD countries)LatviaLeast developed countries: UN classificationLebanonLiberiaLibyaLithuaniaLow & middle incomeLow incomeLower middle incomeLuxembourgMacao SAR, ChinaMacedonia, FYRMadagascarMalawiMalaysiaMaliMaltaMauritaniaMauritiusMexicoMiddle East & North AfricaMiddle East & North Africa (excluding high income)Middle East & North Africa (IDA & IBRD countries)Middle incomeMongoliaMontenegroMoroccoMozambiqueMyanmarNetherlandsNew CaledoniaNew ZealandNicaraguaNigerNigeriaNorth AmericaNorwayOECD membersOmanOther small statesPacific island small statesPakistanPanamaPapua New GuineaParaguayPeruPhilippinesPolandPortugalPost-demographic dividendPre-demographic dividendQatarRomaniaRussian FederationRwandaSamoaSaudi ArabiaSenegalSerbiaSierra LeoneSingaporeSlovak RepublicSloveniaSmall statesSomaliaSouth AfricaSouth AsiaSouth Asia (IDA & IBRD)SpainSri LankaSt. Kitts and NevisSt. LuciaSt. Vincent and the GrenadinesSub-Saharan Africa Sub-Saharan Africa (excluding high income)Sub-Saharan Africa (IDA & IBRD countries)SudanSurinameSwedenSwitzerlandSyrian Arab RepublicTanzaniaThailandTogoTrinidad and TobagoTunisiaTurkeyUgandaUkraineUnited Arab EmiratesUnited KingdomUnited StatesUpper middle incomeUruguayVenezuela, RBVietnamWorldYemen, Rep.ZambiaZimbabwe La ligne de temps
Cette échelle de temps montre un graphique de 1961 année à 2015 année Algeria. Les données jusqu'à 1960 année ne sont pas présentés. Quantité d'observations actuelles selon dates: 51.
Source (désignation):
Les indicateurs du développement mondiale
Source (organisation):
World Bank staff estimates based data from International Monetary Fund's Direction of Trade database.
Catégories:
Private Sector, Trade
Dernière mise à jour
23 avr. 2017
Les indicateurs de changement de valeurs selon les années
Minimum:
0.018
1 janv. 1978
Maximum:
8.705
1 janv. 2000
Pour la date d''observation
Valeur
Changement absolu
Le changement par rapport à la valeur précédente
1 janv. 1961
0.127
+0.127
0.0%
1 janv. 1962
0.137
+0.01
7.81%
1 janv. 1967
0.032
-0.105
-76.52%
1 janv. 1968
0.401
+0.369
1.15 milles%
1 janv. 1969
1.108
+0.707
176.22%
1 janv. 1970
1.398
+0.291
26.24%
1 janv. 1971
2.009
+0.611
43.67%
1 janv. 1972
1.769
-0.24
-11.94%
1 janv. 1973
3.015
+1.245
70.4%
1 janv. 1974
0.342
-2.672
-88.65%
1 janv. 1975
2.614
+2.272
664.09%
1 janv. 1976
1.688
-0.926
-35.42%
1 janv. 1977
1.158
-0.53
-31.4%
1 janv. 1978
0.018
-1.14
-98.42%
1 janv. 1979
0.933
+0.914
5.0 milles%
1 janv. 1980
0.656
-0.277
-29.69%
1 janv. 1981
0.821
+0.165
25.18%
1 janv. 1982
1.773
+0.952
115.97%
1 janv. 1983
1.199
-0.574
-32.39%
1 janv. 1984
0.966
-0.232
-19.37%
1 janv. 1985
0.679
-0.287
-29.7%
1 janv. 1986
1.53
+0.851
125.26%
1 janv. 1987
1.445
-0.086
-5.61%
1 janv. 1988
1.309
-0.135
-9.35%
1 janv. 1989
1.353
+0.044
3.34%
1 janv. 1990
2.038
+0.684
50.57%
1 janv. 1991
2.052
+0.015
0.73%
1 janv. 1992
2.38
+0.327
15.94%
1 janv. 1993
3.381
+1.001
42.05%
1 janv. 1994
5.025
+1.644
48.64%
1 janv. 1995
2.677
-2.348
-46.73%
1 janv. 1996
2.679
+0.002
0.08%
1 janv. 1997
5.343
+2.664
99.44%
1 janv. 1998
6.074
+0.731
13.68%
1 janv. 1999
7.203
+1.129
18.59%
1 janv. 2000
8.705
+1.502
20.85%
1 janv. 2001
7.794
-0.911
-10.46%
1 janv. 2002
6.266
-1.527
-19.6%
1 janv. 2003
5.284
-0.982
-15.67%
1 janv. 2004
4.758
-0.526
-9.96%
1 janv. 2005
2.864
-1.894
-39.8%
1 janv. 2006
6.971
+4.107
143.38%
1 janv. 2007
4.079
-2.893
-41.49%
1 janv. 2008
3.7
-0.378
-9.28%
1 janv. 2009
3.848
+0.148
4.0%
1 janv. 2010
3.742
-0.106
-2.77%
1 janv. 2011
4.625
+0.884
23.61%
1 janv. 2012
4.938
+0.313
6.76%
1 janv. 2013
5.914
+0.976
19.76%
1 janv. 2014
2.846
-3.068
-51.87%
1 janv. 2015
2.416
-0.43
-15.12%
Classement des pays selon les statistiques actuelles par années


Commentaires: